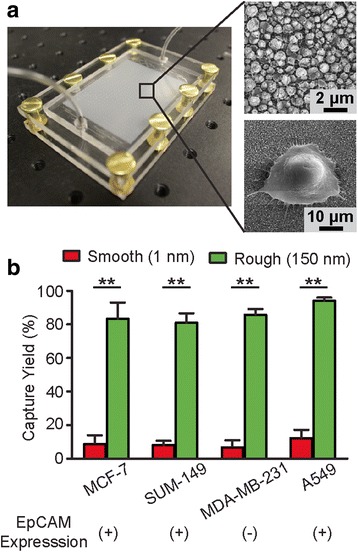
Fig. 1.

Nanotopography-based microfluidic chip for CTC capture. a Photo of the microfluidic CTC capture chip (left) and SEM images (right) showing the nanorough glass surface (top right, R q = 150 nm) and a cancer cell adhered to the surface (bottom right). b Bar graph showing 30 min capture yield for breast cancer cells (MCF-7, MBA-MB-231, and SUM-149) and lung cancer cells (A549) using the capture chip with smooth (R q = 1 nm) and nanorough (R q = 150 nm) glass surfaces as indicated. For each cell type, 1,000 cells were spiked in 1 mL lysed human blood. EpCAM expression of each cell line is denoted below the graph. Error bars, s.e.m. (n = 4). **, p < 0.01
