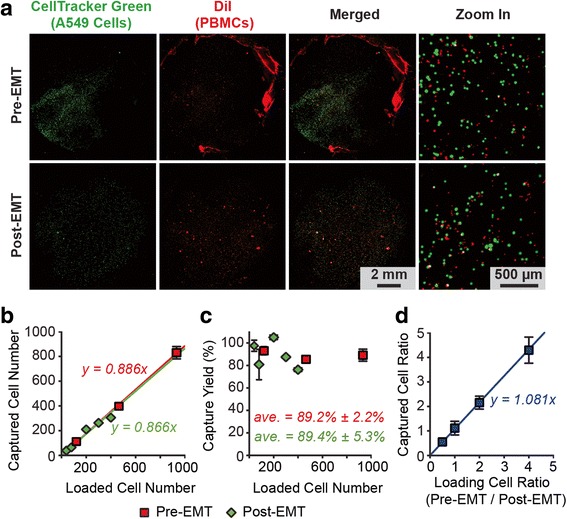
Fig. 2.

Capture of pre- and post-EMT lung cancer cells using the nanotopography-based microfluidic CTC capture chip. a Representative staining images showing pre- (top) and post-EMT (bottom) A549 cells captured on nanorough glass surfaces (R q = 150 nm) 1 h after cell seeding. 10,000 pre- and post-EMT A549 cells labeled with CellTracker Green were spiked in 500 μL lysed blood that was pre-stained with DiI to label peripheral blood mononuclear cells (PBMCs). b & c Regression analysis of 1 h capture efficiency for pre- and post-EMT A549 cells (n = 40–900 spiked in 500 μL lysed blood) using the microfluidic CTC capture chip. The number of A549 cells captured (b) and the capture yield (c) is plotted as a function of the total number of A549 cells spiked in blood samples. d Ratio of pre- and post-EMT A549 cells captured 1 h after cell seeding as a function of their ratio when spiked in blood samples. 1,000 post-EMT A549 cells were mixed with 500–4,000 pre-EMT cells in 500 μL lysed blood to achieve ratios from 2 : 1 to 1 : 4. Solid lines in b & d represent linear fitting. Error bars, s.e.m. (n > 4)
