Fig. 1.

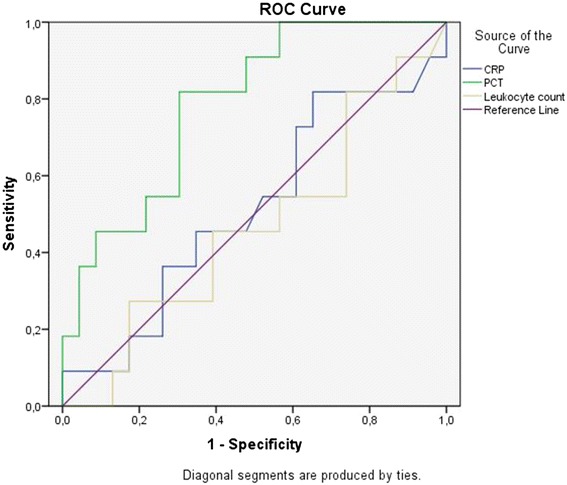
ROC plots for CRP, PCT and leukocyte count predicting positive SF. ROC = Receiver Operating Curves, CRP = C-reactive protein, PCT = procalcitonin; “ties” explain two equal values

ROC plots for CRP, PCT and leukocyte count predicting positive SF. ROC = Receiver Operating Curves, CRP = C-reactive protein, PCT = procalcitonin; “ties” explain two equal values