
Fig. 3.
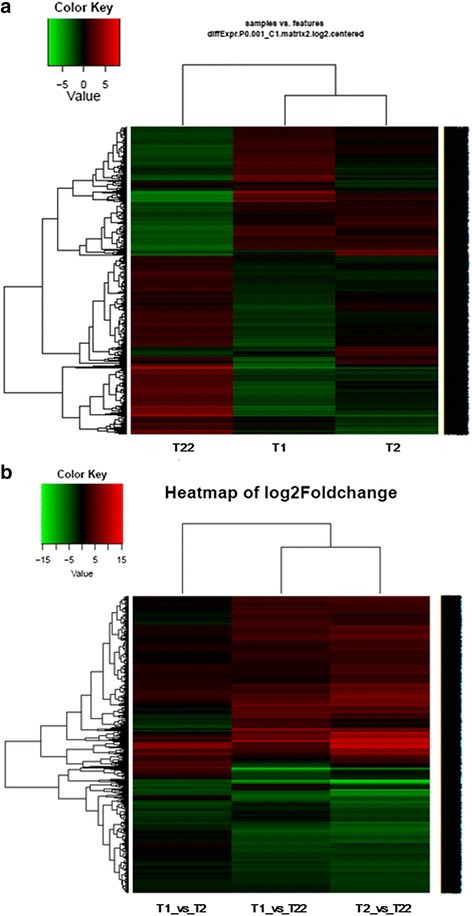
Expression pattern of DEGs screened between samples collected at big yolk plug (T1), wide neural plate formation (T2) and 64 day (T22) stages of A. baeri. a Heatmap of DEGs between samples based on FPKM units; the color key represents FPKM normalized log2 transformed counts and each row represents a gene. b heatmap of Log2(foldchange) of DEGs screened by pairwise comparison of the three samples