Fig. 2.

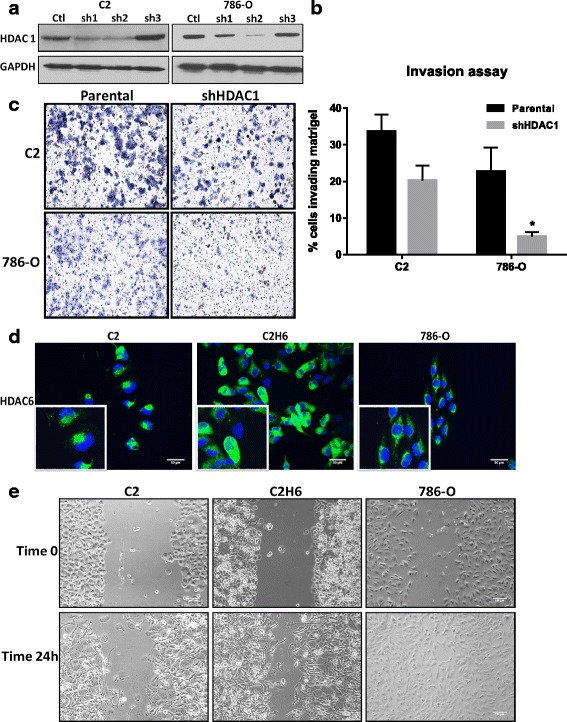
HDAC 1 and HDAC 6 increase cell invasion and migration in RCC cells, respectively. HDAC 1 was knocked down in 786–0 and C2 cells using retroviral supernatants. a) Three different clones with HDAC 1 knock down were generated and Sh2 was chosen in both cell lines for further experiments. b) BD biocoat matrigel chambers were used for measuring the invasion capacity of parental and HDAC 1 knocked down cells. C2 cells were incubated in the chamber for 24 h, whereas 786–0 cells were incubated for a short time point of 6 h. Cells at the bottom of the wells were visualized by crystal violet staining. c) Cells at the bottom of the well were counted blindly using a bright field microscope. *p < 0.05 indicates statistically different number of cells in shHDAC1 cells as compared to the parental cells. The error bars represent standard errors from biological triplicate experiments with technical replicates within each experiment. d) Representative images of renal tumor cell lines analyzed for HDAC 6 expression by immunofluorescence are shown. Scale bar indicates 50 μM distance and images are taken at 20X magnification. e) Representative images of scratch assays performed on C2, C2 overexpressing HDAC 6 and 786-O cells at time 0 and at the end of 24 h are shown
