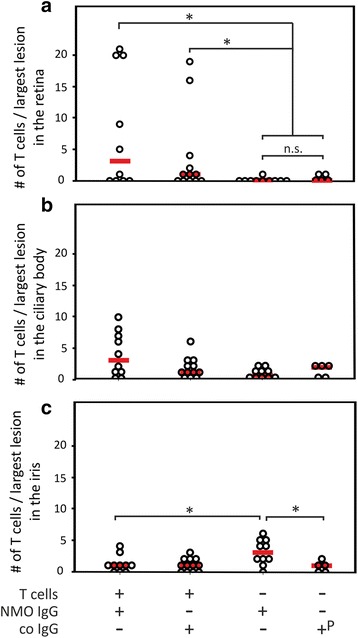
Fig. 2.

Retinitis in the eye of animals with ENMO. Median T cell numbers seen in the largest lesion within the retina (a), ciliary body (b) and iris (c) per rat after injection of AQP4268–285-specific T cells and NMO-IgG (n = 10), AQP4268–285-specific T cells and control IgG (n = 12), NMO-IgG (n = 10), and control IgG (n = 3) or PBS (n = 2). The animals receiving control IgG and PBS were pooled (P). (a) In the retina, differences between NMO-IgG injected and control IgG or PBS injected rats were not significant (p = 0.505), while differences between this group and the AQP4268–285-specific T cells and NMO-IgG injected and the AQP4268–285-specific T cells and control IgG injected groups were significant (* p = 0.03 and 0.044, respectively). (b) In the ciliary body, there were no statistically significant differences between the 4 different groups after correction for multiple comparison. (c) In the iris, statistically higher numbers of T cells were found in animals injected with NMO-IgG only in comparison to the AQP4268–285-specific T cells and NMO-IgG and the co IgG/PBS injected groups (* p = 0.038 and 0.031, respectively,). In all cases, the Mann-Whitney exact U test with Bonferroni correction for multiple comparisons was used
