Fig. 2.

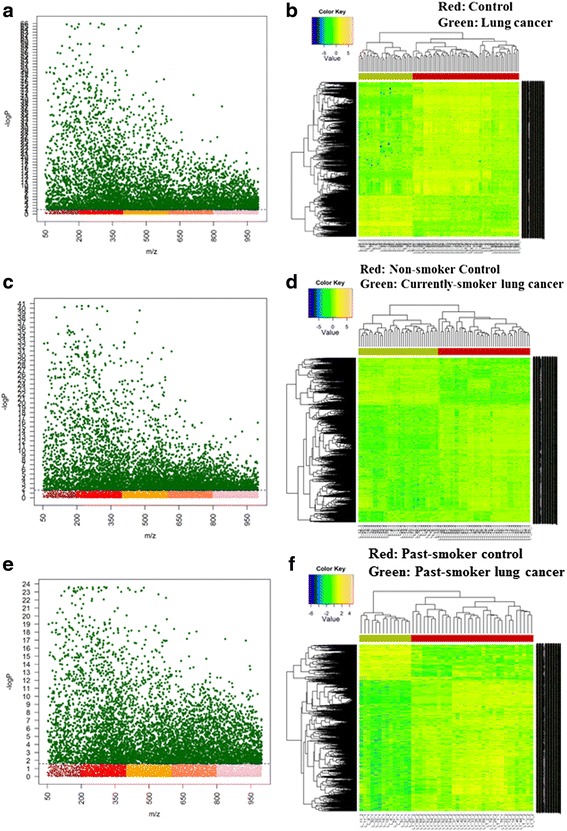
Metabolome-wide association study (MWAS). Manhattan plot (a, c, e) and HCA (b, d, f) using FDR significant features of: (a–b) control vs LCPs, (c–d) non-smoker control vs current-smoker LCPs and (e–f) past-smoker control vs past-smoker LCPs

Metabolome-wide association study (MWAS). Manhattan plot (a, c, e) and HCA (b, d, f) using FDR significant features of: (a–b) control vs LCPs, (c–d) non-smoker control vs current-smoker LCPs and (e–f) past-smoker control vs past-smoker LCPs