
Fig. 4.
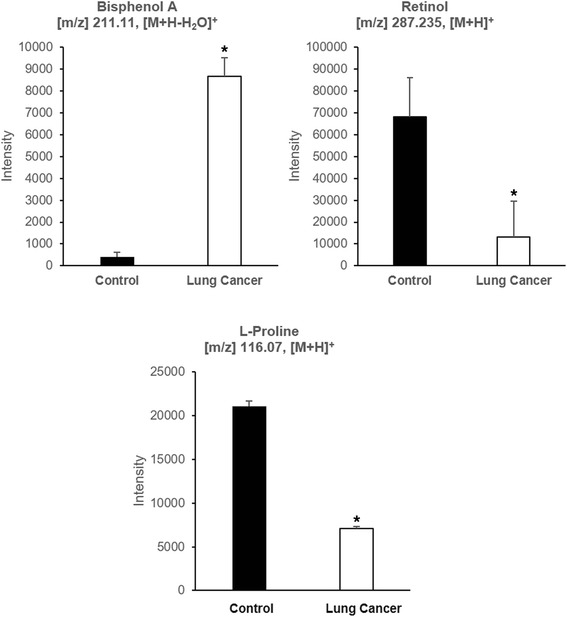
The abundance of selected compounds in control vs LCPs analysis. Relative concentrations of Bisphenol A (a), Retinol (b), and L-proline (c). *shows significant difference (p < 0.05)
Official websites use .gov
A
.gov website belongs to an official
government organization in the United States.
Secure .gov websites use HTTPS
A lock (
) or https:// means you've safely
connected to the .gov website. Share sensitive
information only on official, secure websites.
The abundance of selected compounds in control vs LCPs analysis. Relative concentrations of Bisphenol A (a), Retinol (b), and L-proline (c). *shows significant difference (p < 0.05)