
Fig. 4.
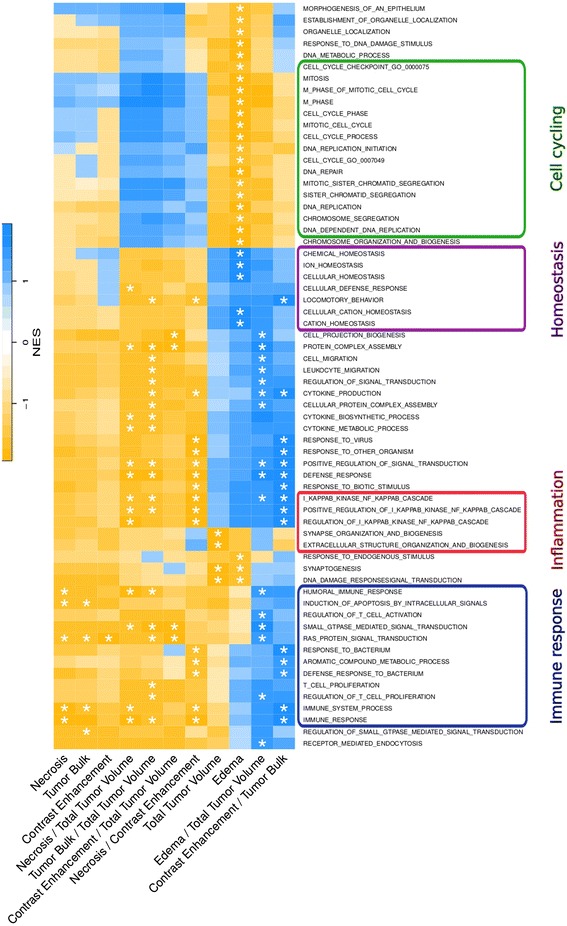
Pathway enrichment analysis. In total, 64 biological processes (rows) were significantly (FDR < 0.05) enriched for at least one volumetric feature (columns) as indicated by an asterisk. Heatmap shows normalized enrichment scores (NES) calculated with Gene Set Enrichment Analysis. Positive NES (blue) correspond to correlated pathways and negative NES (yellow) correspond to anti-correlated pathways