Figure 3.
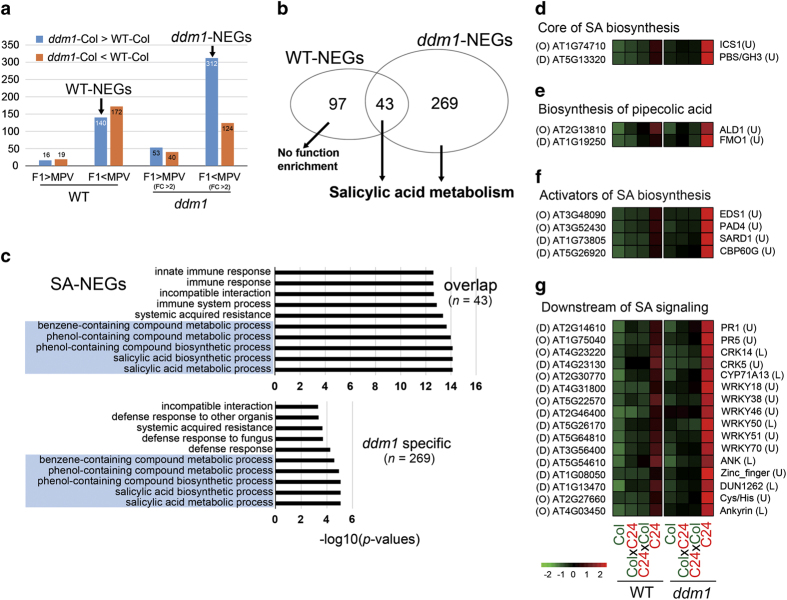
The functional NEGs were enriched in SA metabolism (SA-NEGs). Genes showing differential expression compared with MPVs were defined as NEGs in WT- and ddm1-F1 (a). Venn diagram shows the overlap of WT- and ddm1-NEGs and their functional enrichment in SA metabolism (b). GO-based functional analysis showed that overlapped NEGs between WT and ddm1 are significantly enriched in SA metabolism (c). The NEGs related to SA metabolism were further classified on the basis of their involvement with core SA biosynthesis (d), biosynthesis of pipecolic acid (e), activator of SA biosynthesis (f) and downstream to SA signaling (g). The letter ‘O’ and ‘D’ in brackets before gene IDs indicated that the genes were from ‘overlap’ or ‘ddm1 specifc’ groups in c, respectively. The letter ‘L’ and ‘U’ in brackets after gene names indicated that the gene were from ‘Low-methylation’ or ‘Unmethylated’ groups in Supplementary Figure S7.

