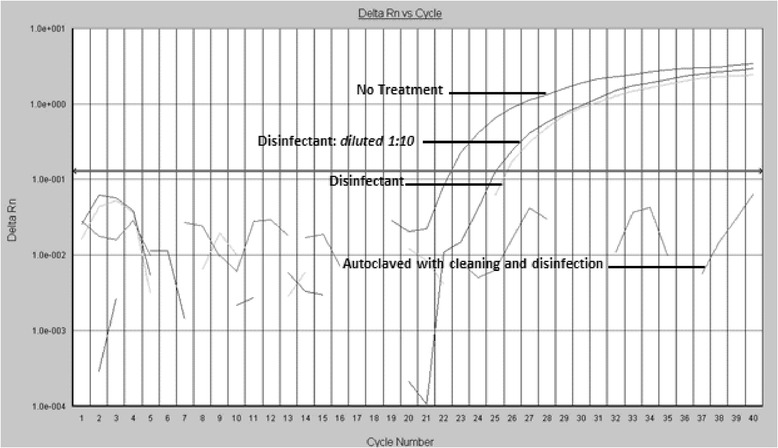
Fig. 2.

Real Time PCR amplification: exemplificative curve from Experimental study trial. Representative amplification plots. Analyses performed on used and disinfected dental mirrors. The comparison of the two plots shows a reduction of about 2–3 CT cycle points after the immersion of the dental mirror in the disinfectant, but the complete absence of signal is observable only after the full reprocessing protocol, including cleaning, disinfection and autoclaving
