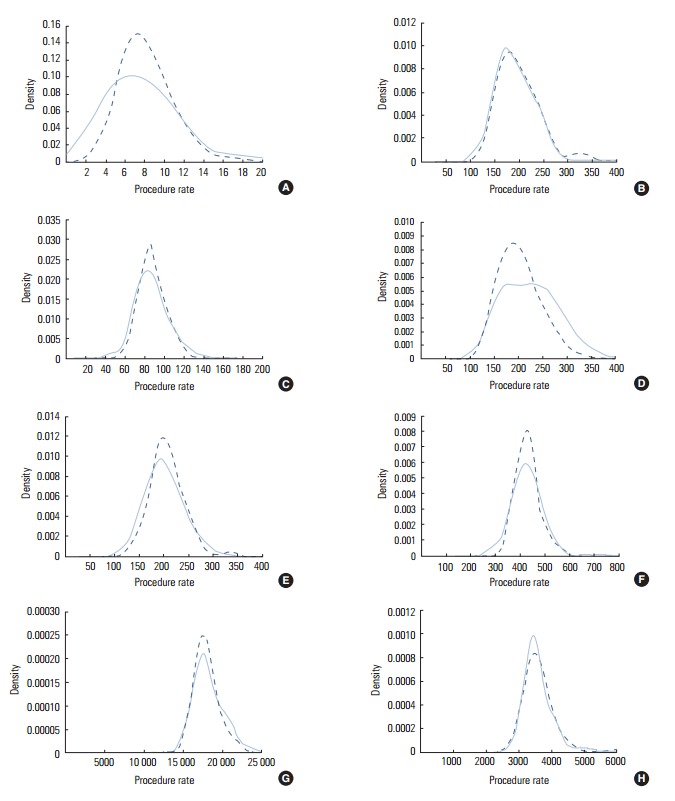
Figure. 3.

The kernel density function for age–sex standardized rates of the eight (A: coronary artery bypass graft surgery, B: percutaneous transluminal coronary angioplasty, C: surgery after hip fracture, D: knee-replacement surgery, E: hysterectomy, F: caesarean section, G: computed tomography scan, and H: magnetic resonance image scan) procedures in the administrative units (districts) and the new areal units. Solid lines represent the rate distribution in the administrative units (districts) and dotted lines represent the rate distribution in the new areal units.
