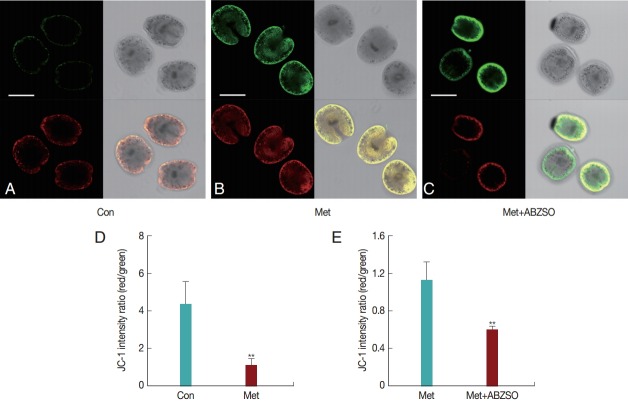
Fig. 2.
Drug-induced apoptosis of protoscolices. Three groups of protoscolices were incubated with JC-1 dye. Images were collected using confocal microscopy, and fluorescence was quantified. Representative images are shown: (A-C) Fluorescence images of different groups (×200), (D, E) Red/green fluorescence ratios measured in the control and drug-treated protoscolices by Image J software. Statistically significant difference compared with the control group, **P<0.01. The scale bar indicates 200 μm (A-C).

