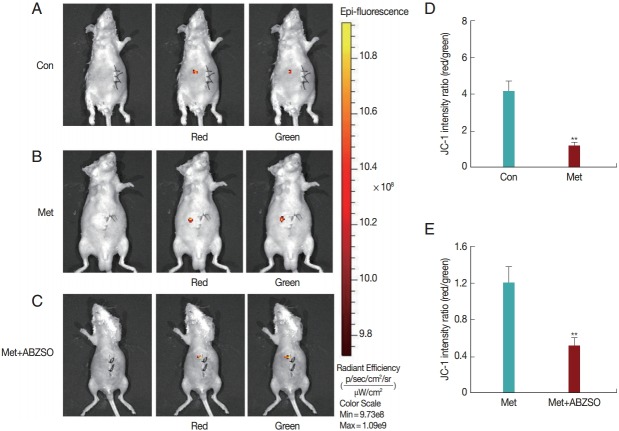
Fig. 4.
Fluorescent imaging of JC-1-labeled protoscolices in vivo. (A-C) Representative whole body fluorescent images of E. granulosus mice in different drug-treatment groups after injection in the supine position. The red/yellow spots indicate fluorescence signals detected by IVIS Spectrum after injection. ROIs were created around the infected region for quantification of fluorescence intensities in each imaging set. The blue number represents real-time values of fluorescence intensity. (D, E) Red/green fluorescence ratios measured in drug-free and drug-treated protoscolices to represent the viability of protoscolices or level of apoptosis. Statistically significant difference compared with the positive control, **P<0.01.

