
Figure 3. Alkbh1 deficiency silences genes on the X chromosome and young full-length L1 elements.
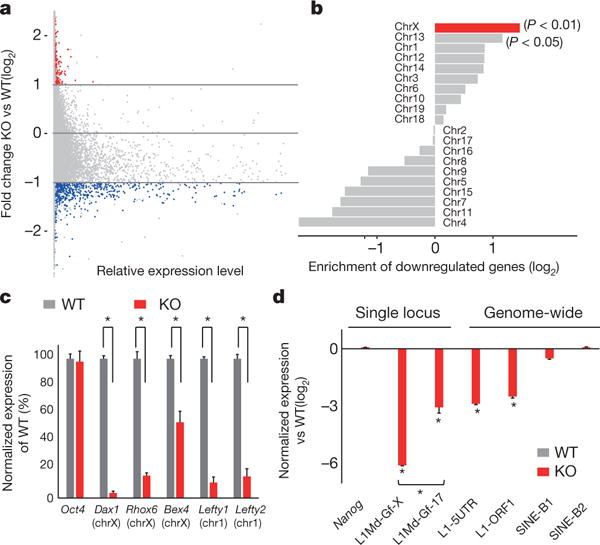
a, RNA-seq analysis of Alkbh1 knockout ES cells versus wild-type controls. Blue: most highly downregulated genes, red: upregulated genes (false positives, see main text). b, Downregulated genes were most enriched on X chromosome (P < 0.01, binomial test) and Chr13 to a lesser extent (P < 0.05, binomial test). c, qRT-PCR analysis of downregulated genes (*P < 0.05, t-test). d, RT-qPCR of transposon expression (*P < 0.01, t-test). L1Md-Gf-X: a young full-length L1 on Chr-X L1Md-Gf-17: a young full-length L1 on Chr17. Error bars, ± s.e.m. of three technical replicates.