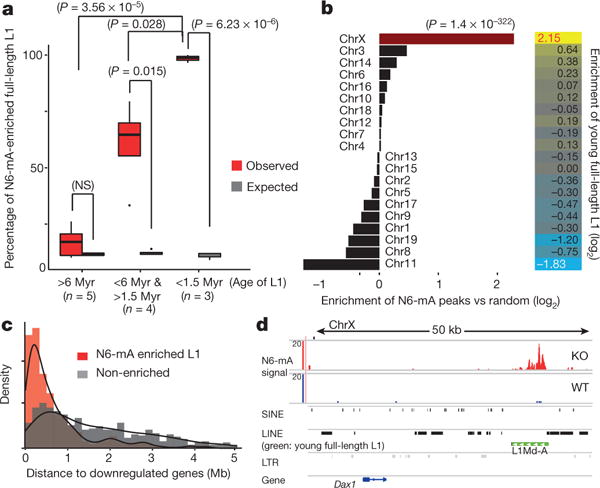
Figure 4. N6-mA is enriched at young full-length L1 elements, which are located in the vicinity of the downregulated genes in Alkbh1 knockout ES cells.

a, Enrichment of N6-mA on full-length L1 elements (P value determined by t-test). b, Left: relative enrichment of N6-mA peaks on each chromosome (P = 1.4 × 10−322, binomial test). Right: relative enrichment of young full-length L1 s on each chromosome. c, Normalized frequency of full-length L1 elements was plotted as a function of their genomic distance to downregulated genes (red, N6-mA enriched, median: 424 kb; grey, non-enriched, median: 1.6 Mb). d, The Dax1 gene locus.
