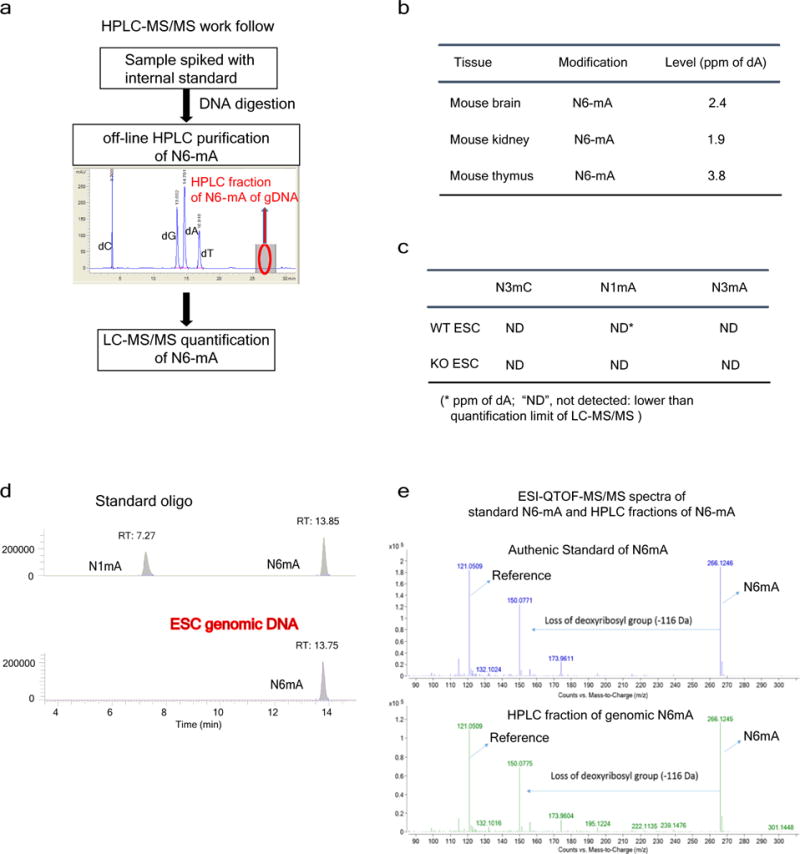
Extended Data Figure 2. LC-MS/MS data of N6-mA.

a, Experimental workflow for determining N6-mA level with LC-MS/MS. [15N5]N6-mA was used as the internal standard. b, N6-mA levels are ultralow in adult tissues. c, No detection of DNA alkylation adducts, such as N1-mA, N3-mA or N3-mC in mouse ES cells or Alkbh1 knockout cells by MS. d, LC-MS/MS analysis of N1-mA or N6-mA digested from synthetic oligonucleotides (top) and ES cell DNA samples (bottom). e, ESI-QTOF-MS/MS spectra of analytical standard of N6-mA nucleosides (top) and N6-mA containing HPLC fraction from ES cells.
