
Extended Data Figure 5. Validation of N6-mA DIP-seq approach.
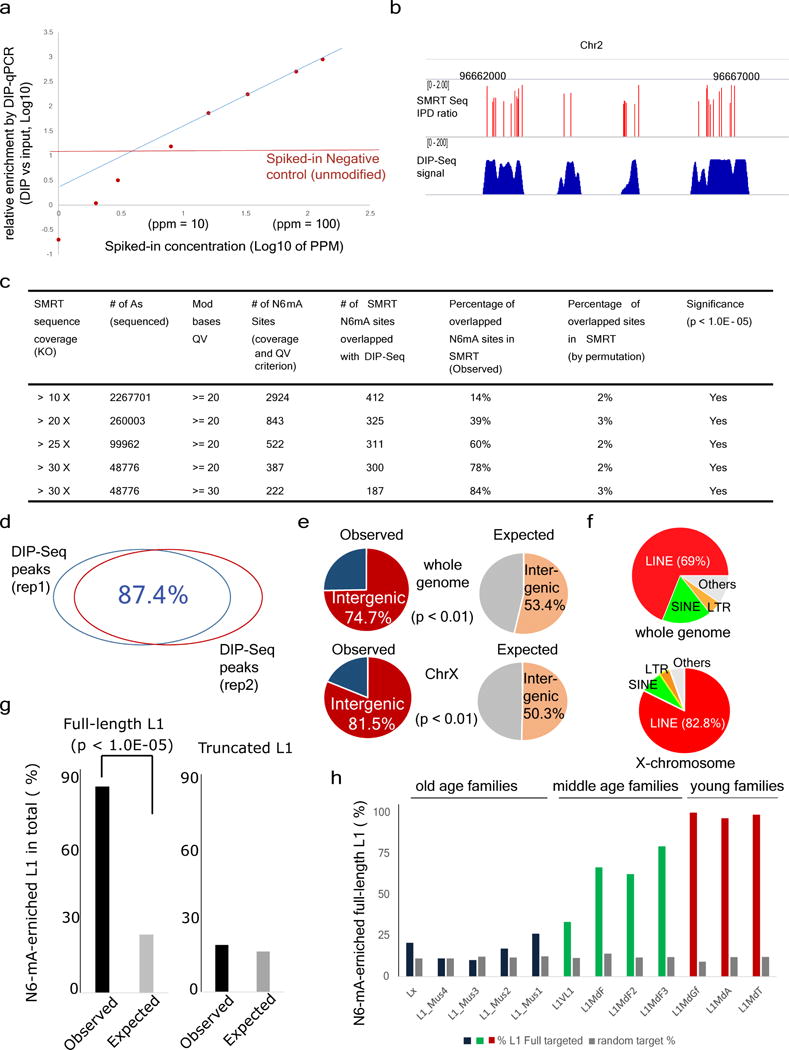
a, ‘Spike-in’ experiments for determining the threshold and linear response range of N6-mA DIP. Genomic DNAs were spiked with N6-mA containing oligonucleotides at indicated concentration (x axis). After N6-mA DIP, the relative enrichment of N6-mA over input control was determined by a RT-qPCR approach. Blue line: linear regression based on data points between 20–130 p.p.m. The threshold (the red line) is the background signals detected by RT-qPCR in which unmodified (control) oligonucleotides were spiked in. b, The track of different sequencing method showed N6-mA sites overlapped between SMRT-ChIP and DIP-Seq in Alkbh1 knockout ES cells. c, Number of SMRT-ChIP N6-mA sites in Alkbh1 knockout cells at different coverage and QV cut-off. With rising coverage and QV cut-off, overlap between SMRT-ChIP N6-mA sites and DIP-Seq N6-mA sites also increases. d, The biological replicates of Alkbh1 knockout ES cells N6-mA-DIP peaks show 87.4% overlap. e, A large majority of N6-mA peaks are in the intergenic regions at the whole-genome level or on the X chromosome. f, In Alkbh1 knockout ES cells, N6-mA peaks are mainly targeted to LINE-1 transposons on the X chromosome or genome-wide. g, N6-mA peaks are significantly enriched on full-length, but not on truncated L1 elements (P < 1.0 × 10⁻⁵, chi-squared test). h, Enrichment of N6-mA in each full length L1 subfamily. Lx, L1_Mus1-4: >6 million years; L1VL1, L1MdF1-4: 1.5–6 million years; L1MdGf, L1MdA, L1mdT: <1.5 million years.