
Extended Data Figure 6. N6-mA enrichment on 5′-end of young full-length L1 elements.
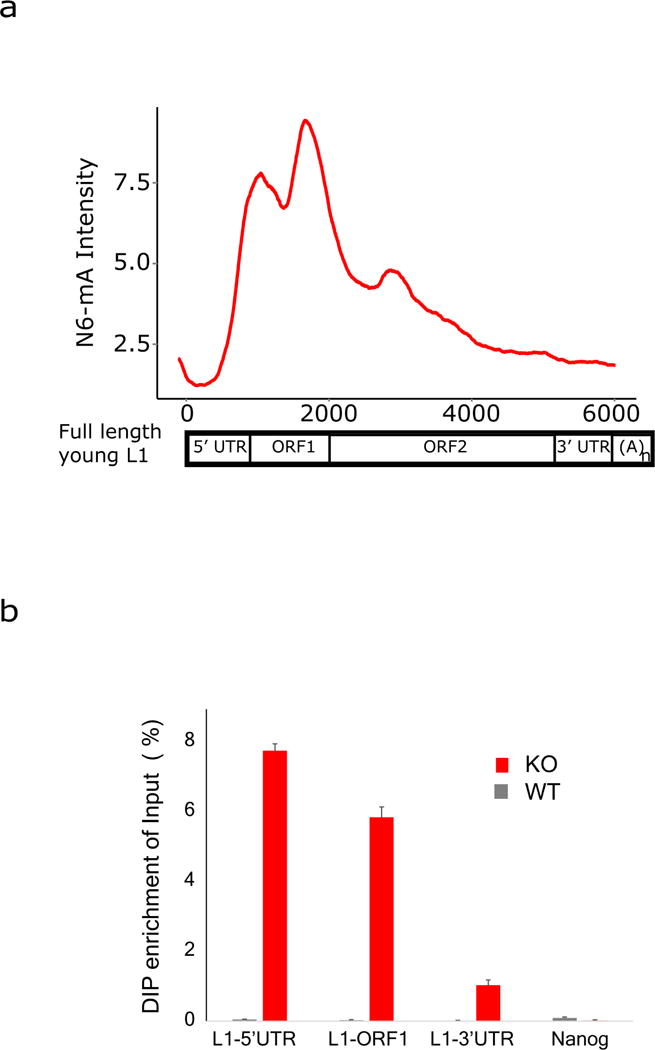
a, Aggregation plot shows that signal intensity of N6-mA at young full-length L1 is enriched at the 5′ UTR and ORF1. b, qPCR analysis of N6-mA DIP samples confirmed the enrichment at the 5′ UTR and ORF1 regions of L1 that are retained in the young full-length L1 elements, but not the 3′ UTR or Nanog promoter.