
Extended Data Figure 7. The correlation between N6-mA deposition on young full-length L1 elements and epigenetic silencing.
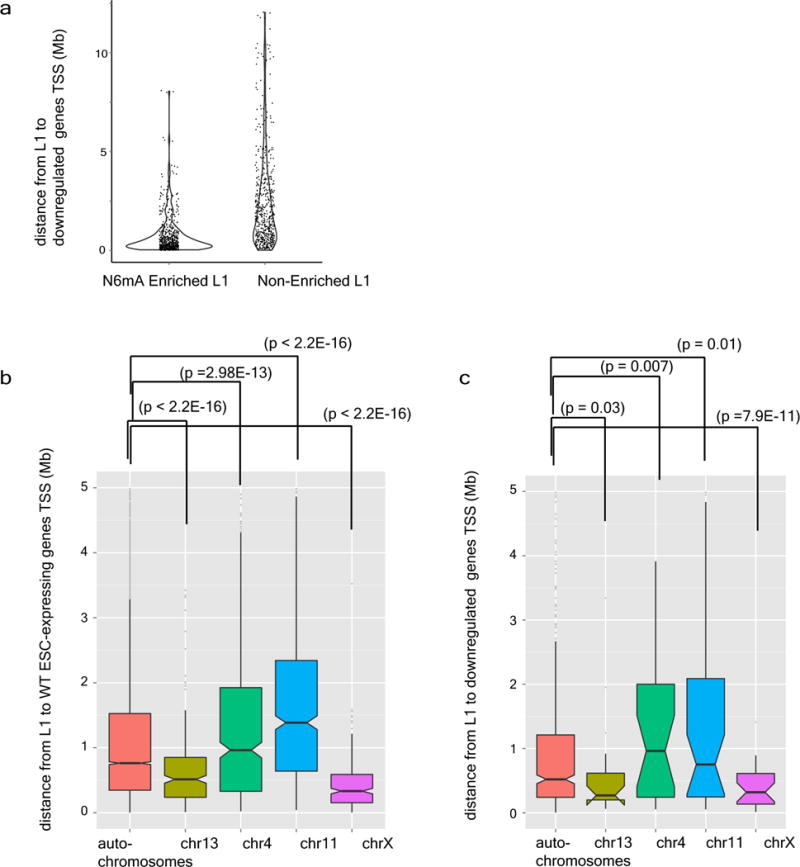
a, Violin diagram of the density distribution of the distance between L1 and downregulated genes in Alkbh1 knockout cells. b, The distances between ES cells expressing genes in Alkbh1 knockout ES cells and young full-length L1 elements were plotted for indicated chromosomes. c, The distances between downregulated genes in Alkbh1 knockout ES cells and young full-length L1 elements were plotted for indicated chromosomes.