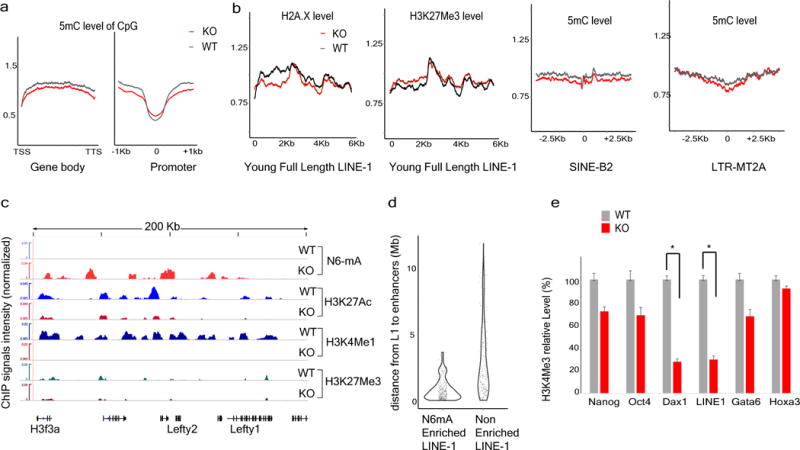
Extended Data Figure 8. N6-mA accumulation correlates with epigenetic silencing.

a, Normalized 5mC levels on gene bodies or promoters in wild-type or Alkbh1 knockout ES cells. b, Histone marks (H2A.X or H3K27Me3) or 5 mC levels on young full-length L1 elements, SINE or LTR transposons. c, Representative sequencing tracks of decommissioned enhancers. H3K27Ac and H3K4me1 levels at this locus are greatly downregulated in Alkbh1 knockout ES cells. See Supplementary Table 2 for all decommissioned enhancers in Alkbh1 knockout ES cells. d, Violin diagram shows the density distribution of the distance between L1 and decommissioned enhancers in Alkbh1 knockout cells. e, ChIP-qPCR approach showed that H3K4me3 levels are decreased at the transcription start sites (TSS) of LINE-1 or Dax1, an X chromosome gene, while unchanged at the control gene TSS. *P < 0.01, t-test; error bars, ± s.e.m. of three technical triplicates.
