
Fig. 3.
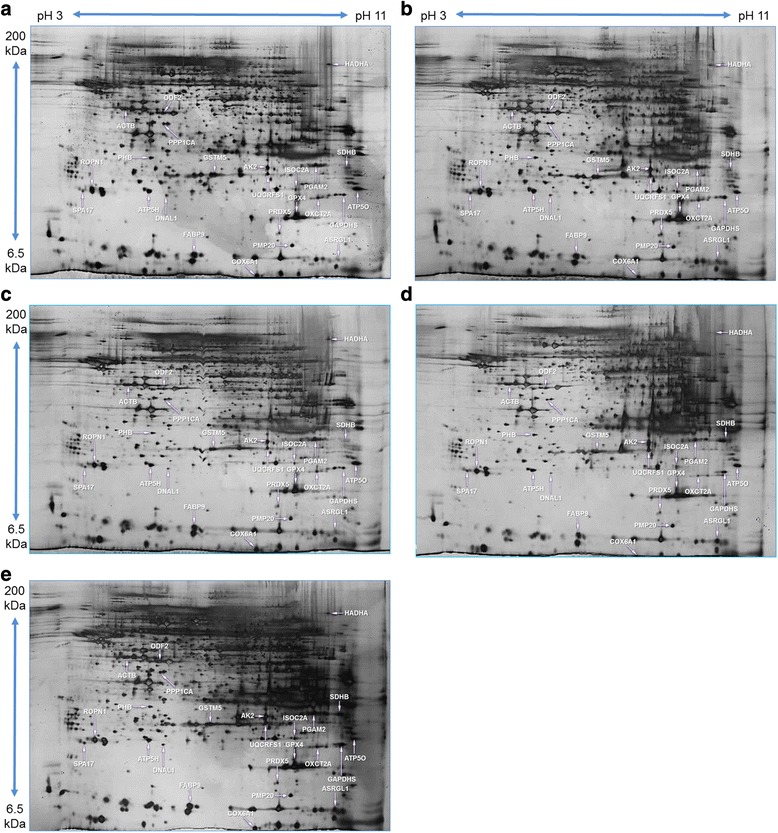
Representative silver nitrate stained image of 2-DE protein spot. (a) Protein spots of control spermatozoa. (b) Protein spots of 0.0001 μM of BPA-treated spermatozoa. (c) Protein spots of 0.01 μM of BPA-treated spermatozoa. (d) Protein spots from 1 μM of BPA treated-spermatozoa. e Protein spots of 100 μM BPA-treated spermatozoa