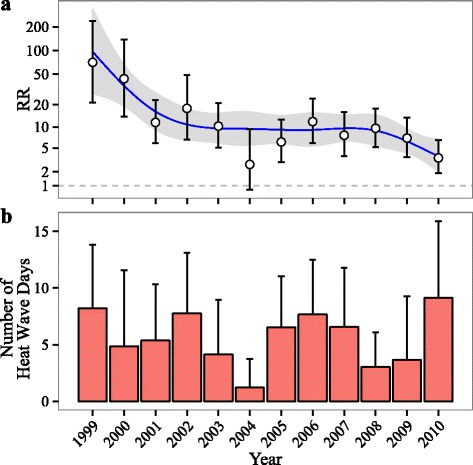
Fig. 2.

Temporal trend of (a) the relative risk (RR) of heat stroke on heat wave days compared to matched control days and (b) the average number of heat wave days per county per year over 1999–2010 (the error bars represent one standard deviation). The smoothed trends for the RR were estimated by natural splines with five degrees of freedom. The models controlled for indicator variables for day of the week. The RR (e.g. RR = x) should be interpreted as the risk of heat stroke admissions on heat wave days was x times the risk on matched non-heat wave days
