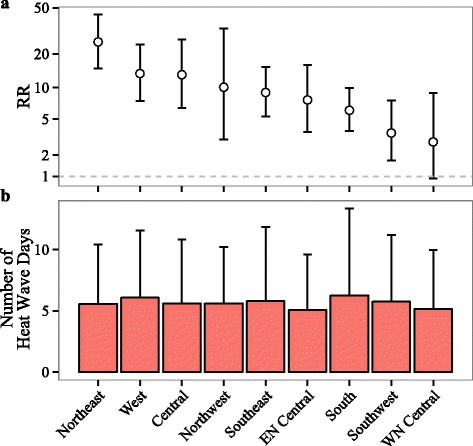
Fig. 3.

Spatial variation of (a) the relative risk (RR) of heat stroke on heat wave days compared to matched control days, and (b) the average number of heat wave days per county per year across the climate regions (the error bars represent one standard deviation). The model controlled for indicator variables of year and day of the week
