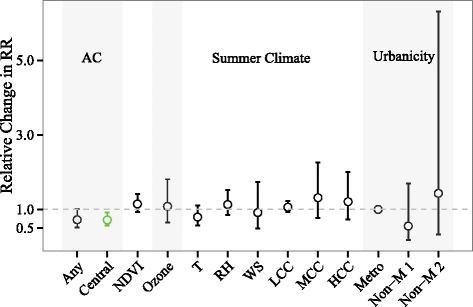
Fig. 4.

Relative change in the relative risk (RR) of heat stroke on heat wave days compared to matched non-heat wave days associated with changes in county-level covariates: AC prevalence (any and central AC, per 10 % increase), mean summer NDVI (per 0.1 increase), mean ozone concentration (per 10 ppb increase), summer climate [temperature (T): per 10 °F; RH: per 10 %; wind speed (WS): per 0.5 km h−1 increase; low cloud cover (LCC), medium cloud cover (MCC), high cloud cover (HCC): per 5 %], and urbanicity [metropolitan (Metro); non-metropolitan with population >20,000 (Non-M 1); non-metropolitan with population < 20,000 (Non-M 2)]. Estimates and error bars in green indicate modifiers that decrease the RR and whose confidence intervals exclude one. The models include both random slopes and random intercepts. The y-axis represents the ratio of the RR per the specified increase in each modifier, obtained as the exponent of the coefficient for the interaction term between the heat wave day indicator variable and the covariate
