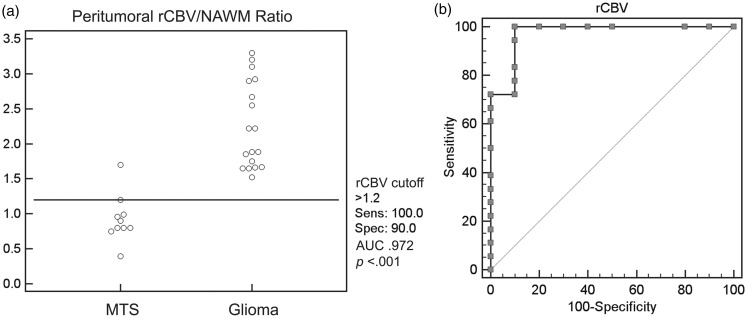
Figure 2.
(a) Scatterplot demonstrating a relative cerebral blood volume (rCBV) cut-off value of 1.20 to differentiate between a metastasis (MTS) and a glioma. (b) Receiver operating characteristic curve demonstrating 100% sensitivity and 90% specificity of rCBV cut-off value of 1.20 to differentiate between a metastasis and a glioma. AUC: area under the curve; NAWM: normal-appearing white matter.

