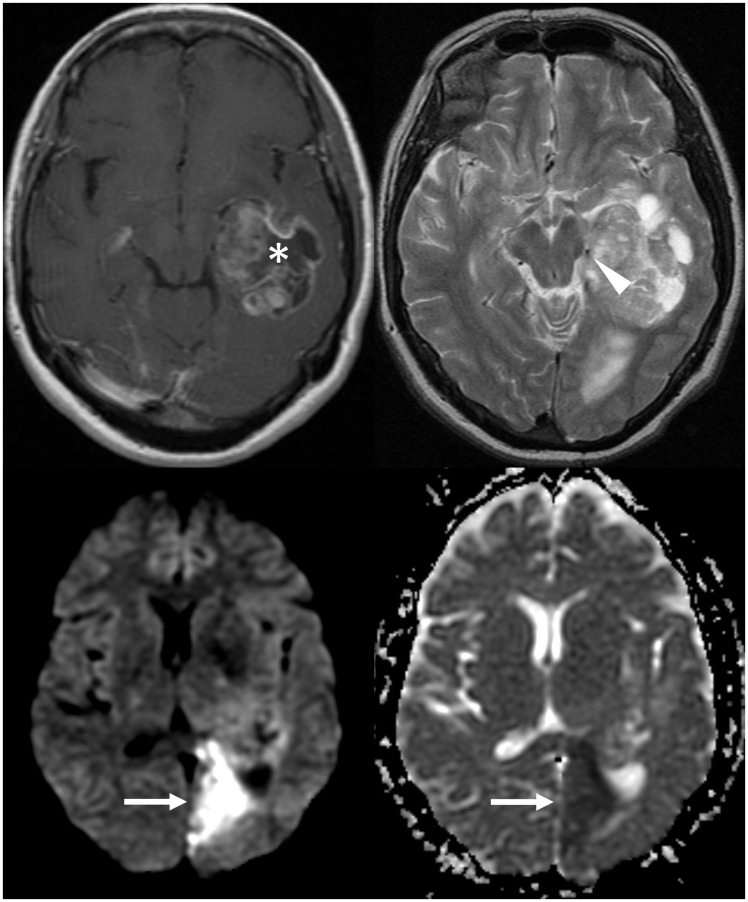
Figure 1.
The post-contrast image (top left) shows the rim-enhancing glioblastoma. On the T2-weighted sequence (top right), it is causing mass effect on the left posterior cerebral artery (arrowhead). The subsequent ischaemic stroke is demonstrated by diffusion restriction in the left posterior cerebral artery territory (arrows), with high signal on DWI (bottom left) and low signal on ADC (bottom right). DWI: diffusion-weighted imaging; ADC: apparent diffusion coefficient.

