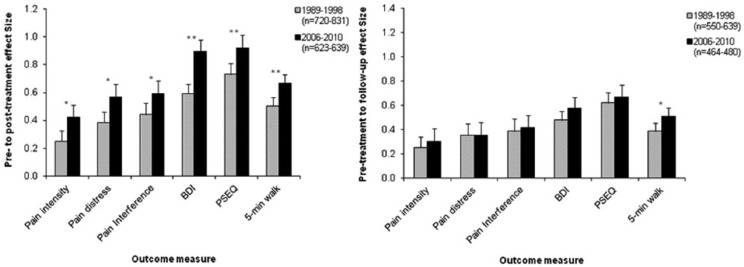
Figure 1.
Effect sizes of pre-to-post-treatment (left) and pre-treatment to follow-up (right) differences for PMP patient cohorts 1989–1998 and 2006–2010. Note: Intensity, rating of how intense pain was on average in previous 7 days; Distress, rating of how distressing pain was on average in previous 7 days; Interference, rating of disruptiveness of pain on normal activities in previous 7 days; BDI, Beck Depression Inventory; PSEQ, Pain Self Efficacy Questionnaire; Error bars represent the 95% confidence interval.
*Indicates significant differences between cohorts (*p < .01; **p < .001).

