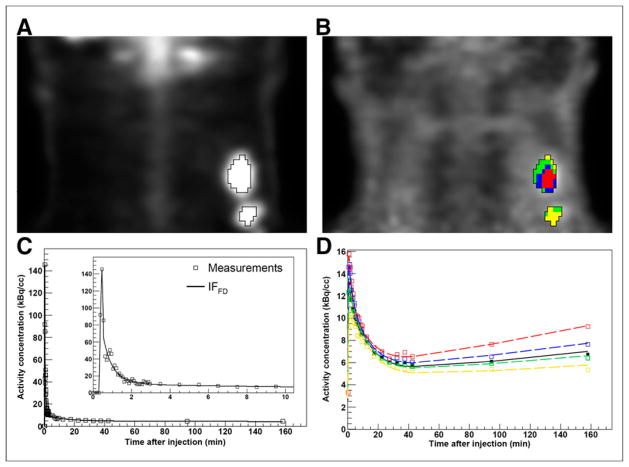
FIGURE 1.
Clinical study of patient 1 (lesion 1). (A) Definition of VOI (wVOI) on 18F-FDG PET image (coronal view). (B) wVOI is copied to coregistered 18F-fluoromisonidazole dPET image and subclassified into 4 clusters (cVOIs). (C) Modeled input function based on full dataset (IFFD), superimposed on measurements. Insert shows initial 10 min of data. (D) Modeled time–activity curves derived from wVOI (solid line) and from 4 cVOIs (dashed lines), superimposed on measured wVOI time–activity curve (■) and cVOI time–activity curves (□). cVOIs are color-coded to those shown in B.

