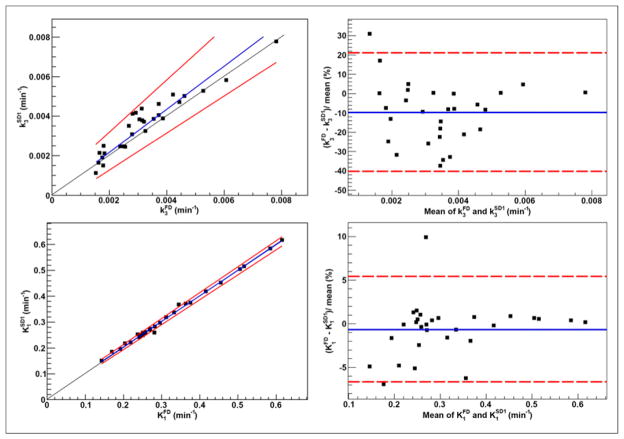
FIGURE 2.
Passing–Bablok regression (left) and Bland–Altman analysis (right) results for k3 (top) and K1 (bottom), calculated using full (FD; ~170 min) and ~100 min shortened (SD1) datasets in clinical studies (n = 29). Also displayed are regression line (blue) and its CIs (red) for Passing–Bablok regression and mean percentage difference (blue) with limits of agreement (red) for Bland–Altman analysis.

