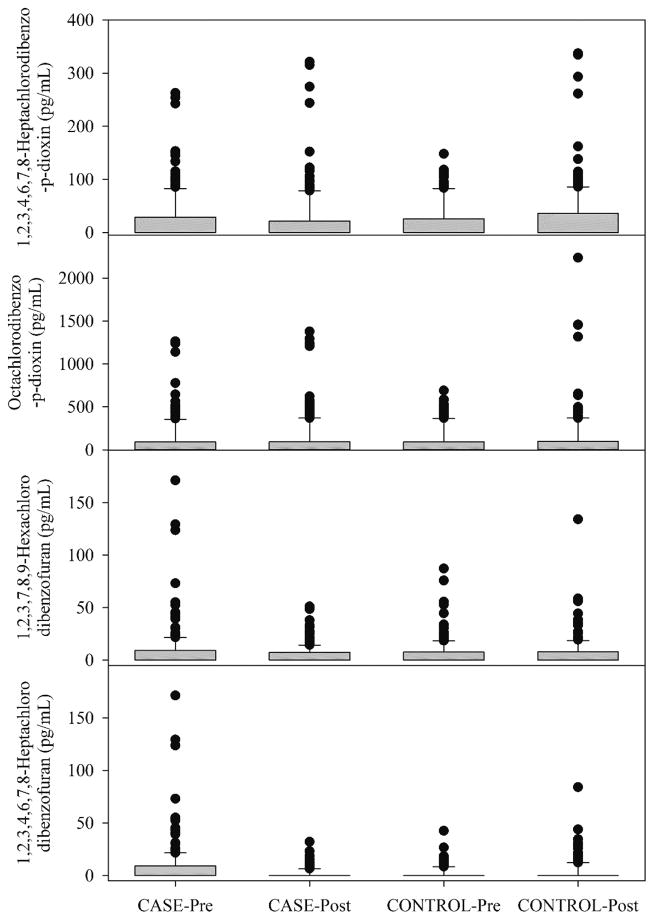
Figure 2.
Box and whisker plot showing the distributions of 1,2,3,4,6,7,8-Heptachlorodibenzo-p-dioxin (HpCDD), Octachlorodibenzo-p-dioxin (OCDD), 1,2,3,7,8,9-Hexachlorodibenzofuran (HxCDF), and 1,2,3,4,6,7,8-Heptachlorodibenzofuran in the serum samples. Boxes represent the distribution from the 25th to the 75th percentiles and the whiskers represent the 10th and 90th percentiles.

