Figure 5.
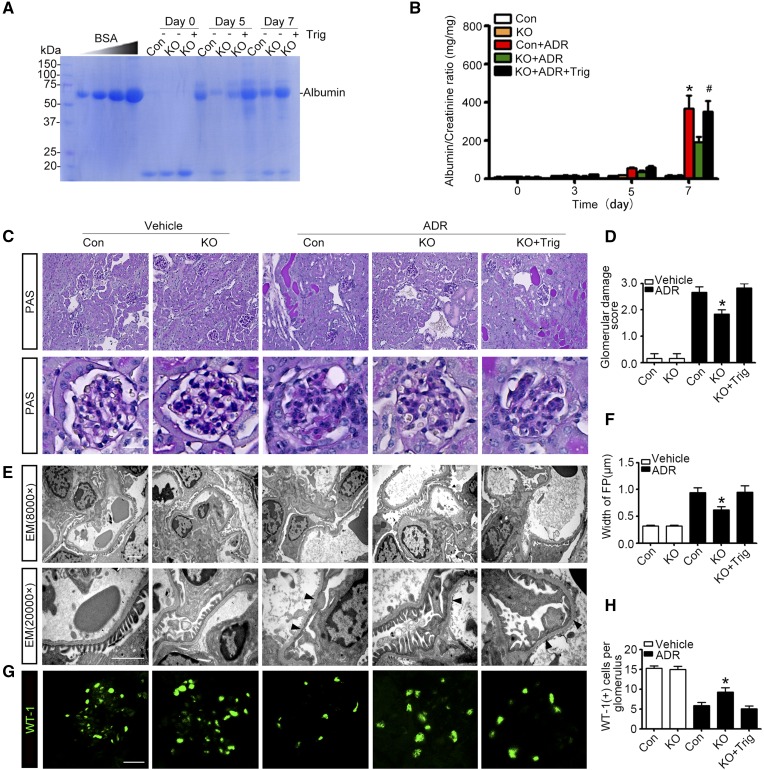
Podocyte-specific deletion of GSK3β ameliorates podocytopathy and proteinuria in experimental doxorubicin nephropathy. (A) KO and control (Con) male mice were injured with a single tail-vein injection of doxorubicin (ADR, 25 mg/kg) or vehicle 1 hour after an intraperitoneal injection of Trig (1 mg/kg) or vehicle. Mice were afterward treated with Trig (1 mg/kg) or vehicle via intraperitoneal injection every other day. Spot urine was collected at the indicated time points, and an aliquot (1.5 µl) was subjected to SDS-PAGE followed by Coomassie brilliant blue staining. BSA (5, 10, 20, and 40 µg) served as standard controls. (B) Quantification of urine albumin levels adjusted by urine creatinine concentrations. The data are expressed as mean±SEM and were subjected to logarithmic transformation and analyzed by repeated-measures ANOVA followed by post hoc Scheffé test. The test for a difference in urine albumin-to-creatinine ratios over time was significant (F[3, 75]=199.831; P<0.01). The test for equality of treatment means over time was also significant (F[4, 25]=34.788; P<0.01). *P<0.05 versus control, KO, or KO+ADR; #P<0.05 versus KO+ADR (n=6). (C) Representative micrographs demonstrate PAS staining of mouse kidneys. Scale bar, 20 μm. (D) Morphometric scoring of glomerular damage on PAS staining of kidney tissues procured from mice on day 7. *P<0.05 versus ADR+control or ADR+KO+Trig (n=6). (E) Electron microscopy (EM) of podocyte ultrastructural injuries in kidney tissues procured from mice on day 7. Arrowheads indicate the lesions of podocyte foot process effacement. Scale bar, 2 μm. (F) Measurement of the width of podocyte foot processes (FP) on electron microscopy in mice on day 7. *P<0.05 versus ADR+control or ADR+KO+Trig (n=6). (G) Representative micrographs of immunofluorescence staining of kidney specimens procured on day 7 for the podocyte-specific marker WT-1. (H) Absolute count of the number of WT-1–positive podocytes in each glomerulus in kidney specimens. *P<0.05 versus ADR+control or ADR+KO+Trig (n=6).

