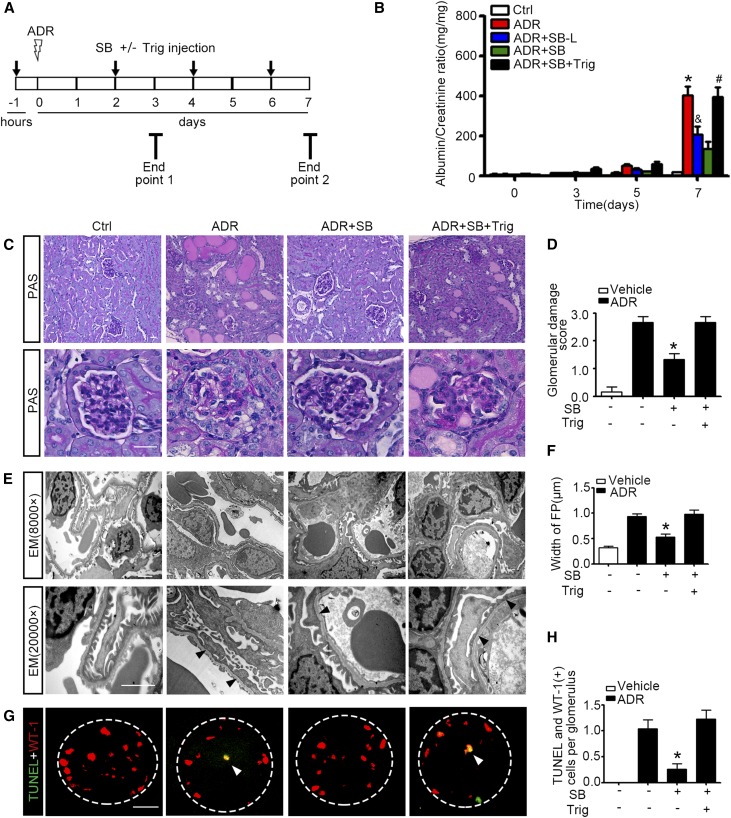
Figure 7.
Pharmacologic targeting of GSK3β by SB216763 attenuates proteinuria and podocytopathy in mice with doxorubicin nephropathy. WT FVB/NJ male mice aged 8 weeks were injured with a single tail-vein injection of doxorubicin (ADR, 25 mg/kg) or vehicle 1 hour after a subcutaneous injection of SB216763 at a dose of 1.5 mg/kg (SB) or a low dose of 0.6 mg/kg (SB-L) with or without intraperitoneal injection of Trig (1 mg/kg). The animals were afterward treated every other day with or without a subcutaneous injection of SB216763 at a dose of 1.5 mg/kg (SB) or at a low dose of 0.6 mg/kg (SB-L) or an intraperitoneal injection of Trig (1 mg/kg). (A) Schematic diagram depicts the animal study designed to test the effect of targeted inhibition of GSK3β by SB216763. (B) Spot urine was collected at the indicated time points and subjected to ELISA quantification of urine albumin levels adjusted by urine creatinine concentrations. The data are expressed as mean±SEM and were subjected to logarithmic transformation and analyzed by repeated-measures ANOVA followed by post hoc Scheffé test. The test for a difference in urine albumin-to-creatinine ratios over time was significant (F[3, 75]=236.348; P<0.01). The test for equality of treatment means over time was also significant (F[4, 25]=16.707; P<0.01). *P<0.05 versus control, ADR+SB-L, or ADR+SB; &P<0.05 versus ADR+SB, #P<0.05 versus ADR+SB (n=6). (C) Representative micrographs demonstrate PAS staining of kidneys procured from animals on day 7. Scale bar, 20 μm. (D) Morphometric scoring of glomerular damage on PAS staining of kidney tissues procured from mice on day 7. *P<0.05 versus ADR or ADR+SB+Trig (n=6). (E) Transmission electron microscopy (EM) of podocyte ultrastructural lesions after doxorubicin injury. Arrowheads indicate lesions of podocyte foot process effacement. Scale bar, 2 μm. (F) Measurement of the width of podocyte foot processes (FP) on electron microscopy in mice on day 7. *P<0.05 versus ADR or ADR+SB+Trig (n=6). (G) Frozen kidney sections were fixed and subjected to dual color fluorescent staining for TUNEL (green) and WT-1 (red). Arrowheads indicate representative glomerular podocytes positive for both TUNEL and WT-1 staining. Scale bar, 20 μm. (H) Absolute count of the number of apoptotic glomerular podocytes positive for both TUNEL and WT-1 staining in each glomerulus as the means of 50 glomeruli. *P<0.05 versus ADR or ADR+SB+Trig (n=6).

