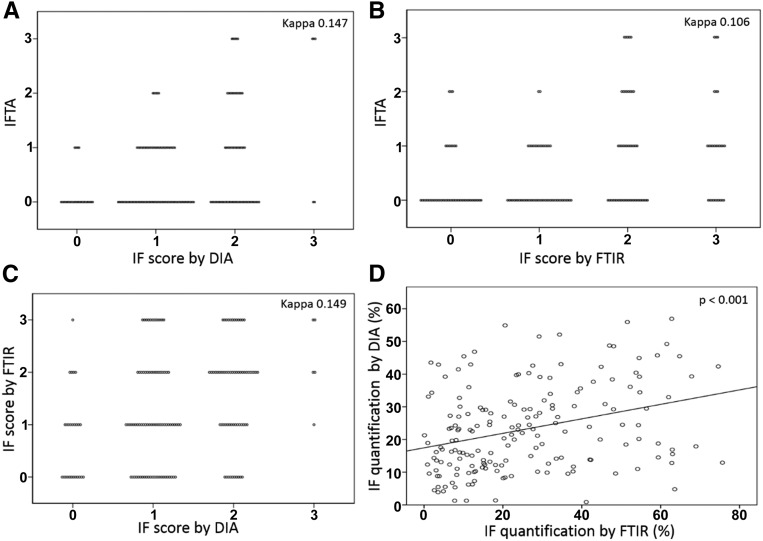
Figure 3.
Comparison of the IF score and quantification by three techniques. The IF score as estimated by visual inspection according to the Banff classification (IFTA) was compared with the IF score as quantified by (A) DIA or (B) FTIR using the LDA model. Score thresholds were homogenized for all techniques (0<10%; 1=10%–25%; 2=25%–50%; and 3>50%). (C) The IF score by DIA was compared with the IF score as quantified by FTIR, showing poor agreement between these two techniques, whereas (D) IF quantification (percentage) by DIA was correlated with IF quantification by FTIR using the LDA model (P<0.001).

