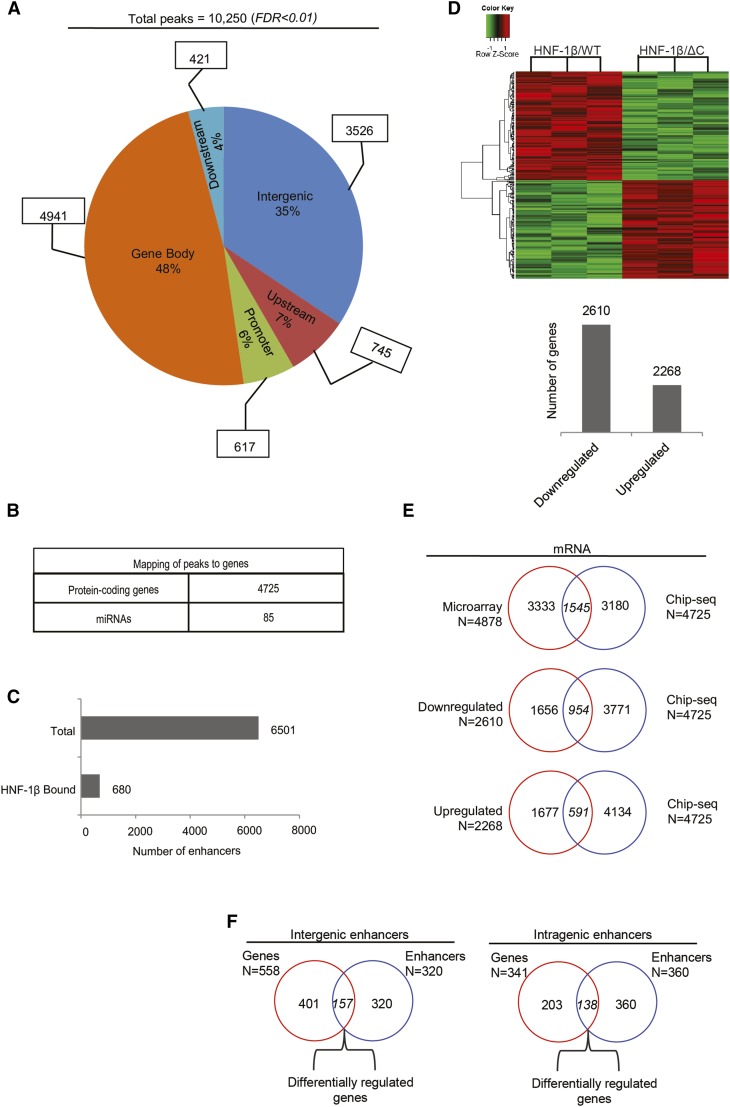
Figure 1.
Genome-wide identification of genes that are directly regulated by HNF-1β in kidney cells. (A) Genome-wide identification of HNF-1β binding sites in chromatin from mIMCD3 renal epithelial cells. The pie chart shows the distribution of HNF-1β binding sites in the indicated genomic regions: promoter regions extending from the transcription start site (TSS) to −1 kb, upstream regions (−1 to −10 kb), gene bodies extending from the TSS to the transcription termination site (TTS), downstream regions (TTS to +5 kb), and intergenic regions (peaks outside of the classified regions). (B) Number of protein-coding genes and miRNAs that are mapped to HNF-1β binding sites. (C) Total number of active enhancers in the kidney identified in the mouse ENCODE Project (upper bar) and number of active enhancers corresponding to HNF-1β binding sites (lower bar). (D) Microarray analysis of mRNA expression in kidney cells expressing HNF-1βΔC. Heat map depicting genes that are differentially expressed in response to induction of the HNF-1βΔC mutant (FDR<0.05). Data shown are from three independent experiments. The numbers of upregulated and downregulated genes are indicated in the histogram. (E) Venn diagrams combining the ChIP-seq data and microarray data to identify direct mRNA targets that are differentially expressed in response to induction of the HNF-1βΔC mutant. (F) Mapping of enhancers to intergenic and intragenic domains. Venn diagrams show the number of genes located in close proximity to enhancers occupied by HNF-1β and differentially expressed in response to induction of the HNF-1βΔC mutant.

