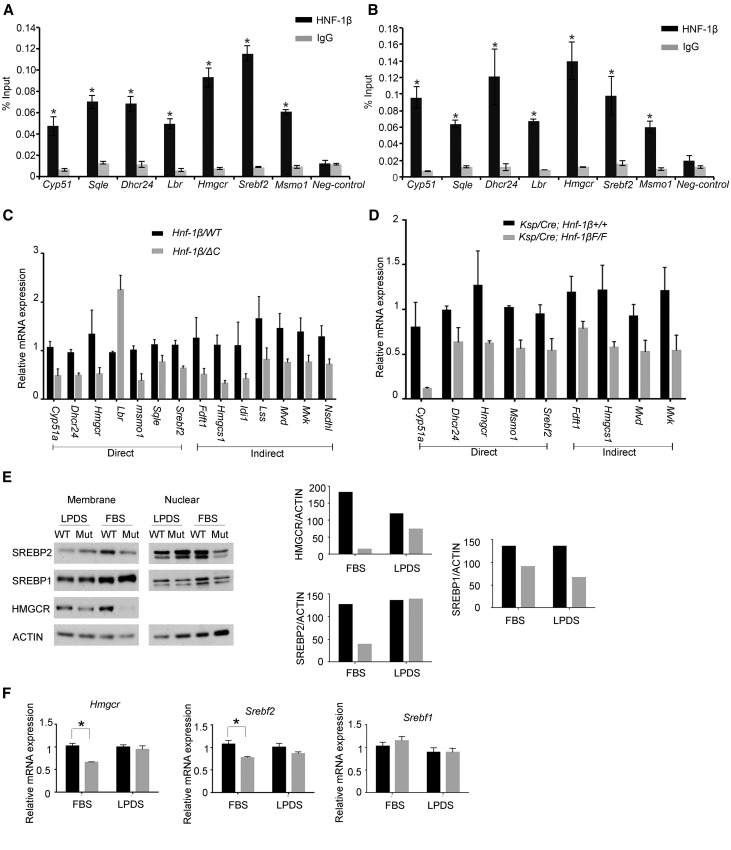
Figure 2.
HNF-1β regulates the expression of genes involved in cholesterol synthesis. ChIP showing occupancy of the indicated genes by endogenous HNF-1β in chromatin from (A) mIMCD3 cells and (B) 28-day-old mouse kidney. Enrichment of HNF-1β binding was calculated using the percentage input method and compared with control IgG. Error bars represent SEM (n=3). *P<0.05. (C) qRT-PCR analysis showing altered expression of genes involved in cholesterol synthesis in cells expressing the HNF-1βΔC mutant (gray bars) compared with wild-type cells (black bars). Direct targets indicate genes that are located near HNF-1β binding sites. Data shown are means±SEMs of three independent experiments. All pairwise comparisons were significantly different (P<0.05). (D) qRT-PCR analysis showing altered expression of genes involved in cholesterol synthesis in kidneys from 28-day-old HNF-1β mutant mice (Ksp/Cre;Hnf-1βF/F; gray bars) compared with control littermates (black bars). Data shown are means±SEMs of three independent experiments. All pairwise comparisons were significantly different (P<0.05). (E) Western blot analysis showing the expression of SREBP-2, SREBP-1, and HMGCR in wild-type cells (WT) and cells expressing the HNF-1βΔC mutant (Mut). Cells were cultured in FBS or LPDS for 48 hours before analysis. Right panel shows densitometric analysis of the HMGCR and nuclear fractions of SREBP1 and SREBP2 normalized to the levels of actin. (F) Expression of Hmgcr, Srebf1, and Srebf2 in wild-type cells (black bars) and cells expressing the HNF-1βΔC mutant (gray bars). Cells were cultured in either 10% FBS or 10% LPDS, induced for 48 hours, and then, subjected to qRT-PCR analysis. Error bars represent SEM. *P<0.05.

