Figure 4.
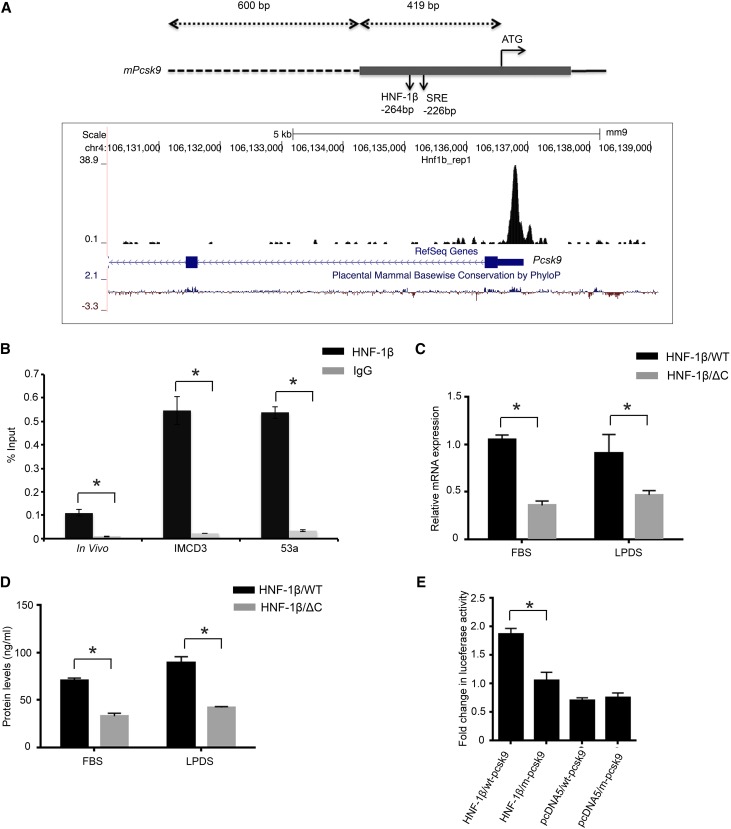
HNF-1β regulates Pcsk9 expression and promoter activity. (A, upper panel) Schematic diagram of the mouse Pcsk9 promoter region showing the HNF-1β binding site and sterol regulatory element (SRE) relative to the ATG start codon. The gray bar indicates the first exon, the dashed line indicates the 5′ flanking sequence, and the line indicates the first intron. (A, lower panel) Genomic coordinates and size bar are shown at the top. HNF-1β binding peaks from ChIP-seq are shown in black. Blue boxes indicate Pcsk9 exons, and arrowheads indicate the direction of transcription. The bottom line indicates evolutionary sequence conservation. Data were visualized using the UCSC Genome Browser.54 (B) Quantitative ChIP-qPCR showing binding of HNF-1β to the indicated region of Pcsk9 in mIMCD3 cells, uninduced 53A cells, and adult kidney. Data shown are means±SEMs of three independent experiments. *P<0.05. (C) Expression of Pcsk9 mRNA in wild-type cells (black bars) and cells expressing the HNF-1βΔC mutant (gray bars) cultured in either FBS or LPDS. (D) ELISA of cleaved PCSK9 protein in wild-type cells (black bars) and cells expressing the HNF-1βΔC mutant (gray bars) cultured in FBS or LPDS. (E) Luciferase assays of Pcsk9 promoter activity. A DNA fragment extending 1019 bp upstream to the ATG start codon and containing 419 bp of the first exon and 600 bp of the 5′ flanking sequence was cloned into a luciferase reporter plasmid. mIMCD3 cells were transfected with equimolar amounts of wild-type (wt-pcsk9) or mutant (m-pcsk9) reporter plasmid and an HNF-1β or control (pcDNA5) expression plasmid. Luciferase activity was measured 48 hours after transfection. Luciferase activity was significantly reduced in m-pcsk9 transfected cells. Data shown are means±SEMs of three independent experiments. *P<0.05.

