Figure 2.
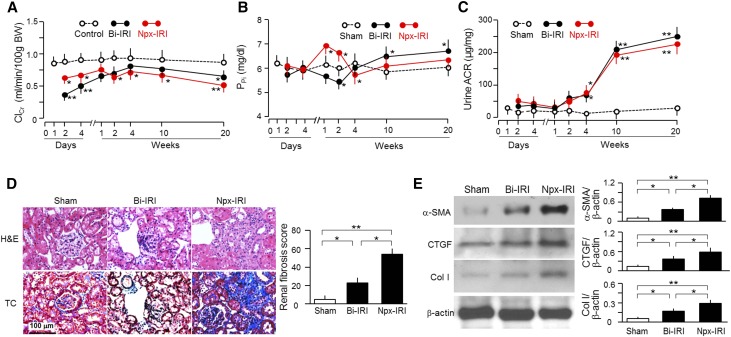
AKI mice develop CKD. Three-month-old WT mice were subjected to 30-minute Bi-IRI or 30-minute Npx-IRI and then fed normal rodent chow for 20 weeks. Blood and urine were collected at designated times for (A) ClCr, (B) PPi, and (C) urine ACR. Data are expressed as means±SDs of at least four mice from each group, and statistical significance was assessed by one-way ANOVA followed by Newman–Keuls test, and accepted when *P<0.05; **P<0.01 versus sham at the same time point for A–C. BW, body weight. (D) Kidney morphology by hematoxylin and eosin (H&E) and Trichrome (TC) staining. (Left panel) Representative micrographs in kidney sections from animals of each group. (Right panel) Renal fibrosis scores obtained from TC-stained sections analyzed with ImageJ. At least four animals were included in each group. (E) Fibrotic markers in the kidney. (Left panel) Representative immunoblot for α-SMA, CTGF, Col I, and β-actin in total kidney lysates. (Right panel) Summary of all immunoblots. Data are expressed as means±SDs of at least four mice from each group, and statistical significance was assessed by one-way ANOVA followed by Newman–Keuls test, and accepted when *P<0.05; **P<0.01 between two groups for D and E.

