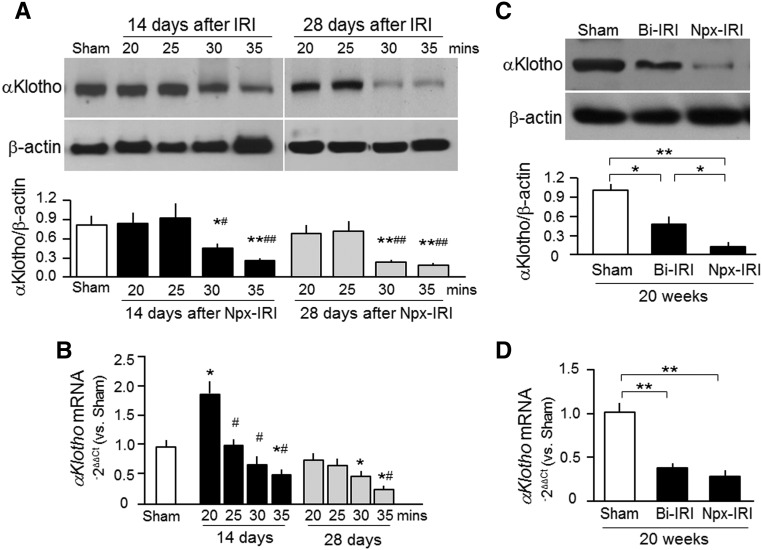
Figure 3.
Renal αKlotho deficiency is present in the course of AKI transition to CKD. (A and B) Three-month-old WT mice underwent Npx-IRI with different durations of ischemia and then were fed normal rodent chow for ≤28 days. (A) Representative immunoblots for αKlotho protein in the kidney are shown in upper panel. Lower panel is a summary of the immunoblots of three independent experiments. (B) αKlotho mRNA expression in the kidney by qPCR. Results are expressed as 2−ΔΔCt with normalization to cyclophilin and then a ratio to the sham group. Data are expressed as means±SDs of three mice from each group, and statistical significance was assessed by one-way ANOVA followed by Newman–Keuls test, and accepted when *P<0.05; **P<0.01 versus sham group; #P<0.05; ##P<0.01 versus 20 minutes. (C and D) Three-month-old WT mice were subjected to Bi-IRI or Npx-IRI and then fed normal rodent chow for 20 weeks. (C) Representative immunoblots for αKlotho and β-actin protein in the kidney (upper panel). Lower panel is a summary of immunoblots of three independent experiments. Data are expressed as means±SDs, and statistical significance was assessed by one-way ANOVA followed by Newman–Keuls test. (D) αKlotho mRNA expression in the kidney was analyzed with qPCR. Results are expressed as 2−ΔΔCt (Ct cycle number) by normalization to cyclophilin and then a ratio to the sham group. Data are expressed as means±SDs of three mice from each group, and statistical significance was assessed by one-way ANOVA followed by Newman–Keuls test, and accepted when *P<0.05; **P<0.01 between two groups.

