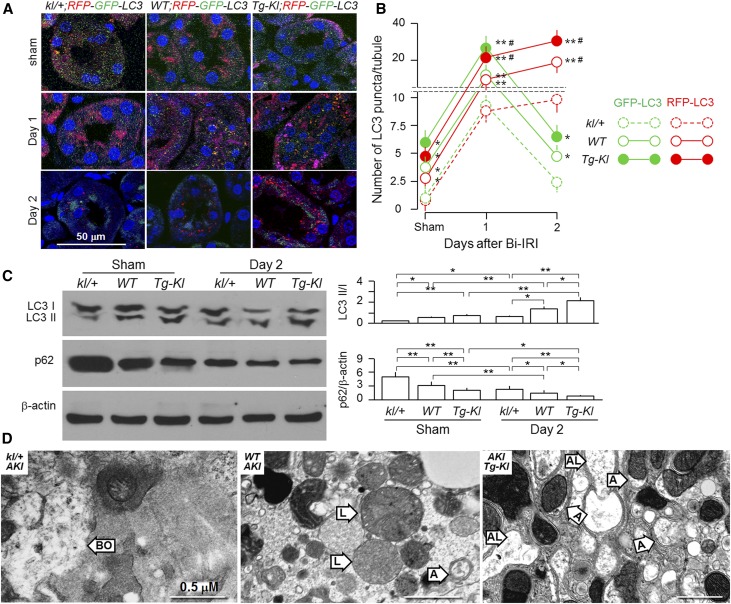
Figure 7.
αKlotho upregulates autophagy and attenuates kidney injury induced by Bi-IRI. Three-month-old mice with three different genetic αKlotho levels and RFP;GFP-LC3 reporter were subjected to Bi-IRI (30-minute ischemia followed by a reperfusion of 1 or 2 days). Sham operation serves as control. (A) Immunofluorescence images for LC3 punctae in the kidneys. Red signal represents RFP-LC3, green signal represents GFP-LC3, yellow signal represents merge of RFP-LC3 with GFP-LC3, and blue signal represents Syto 61 for nuclear stain. Scale bar, 50 μm. (B) The number of RFP-LC3 and GFP-LC3 punctae per renal tubule after analysis of 50 proximal tubules in the zone of cortex plus outer medulla. Results are means±SDs from three independent experiments. Statistical significance was assessed by one-way ANOVA followed by Newman–Keuls test. Statistical significance was accepted when *P<0.05; **P<0.01 versus kl/+ mice; statistical significance was accepted when #P<0.05; ##P<0.01 versus WT mice on same day. (C) Expression of LC3-I and LC3-II and p62 protein in the kidney of mice with three different genetic αKlotho levels at day 2 post-IRI. (Left panel) Representative immunoblots for LC3-II/LC3-I, p62, and β-actin protein in the kidney. (Right panel) Summary of immunoblots from three independent experiments. Results are means±SDs from three independent experiments. Statistical significance was assessed by one-way ANOVA followed by Newman–Keuls test. Statistical significance was accepted when *P<0.05; **P<0.01 between two groups. (D) Representative transmission electron microscopic images of autophagic structures in the kidney of mice with three different genetic αKlotho levels at 2 days post-IRI. A, autophagosome; AL, autophagolysosome; BO, broken organelle in necrotic cells; L, lysosome. Scale bar, 0.5 μm.

