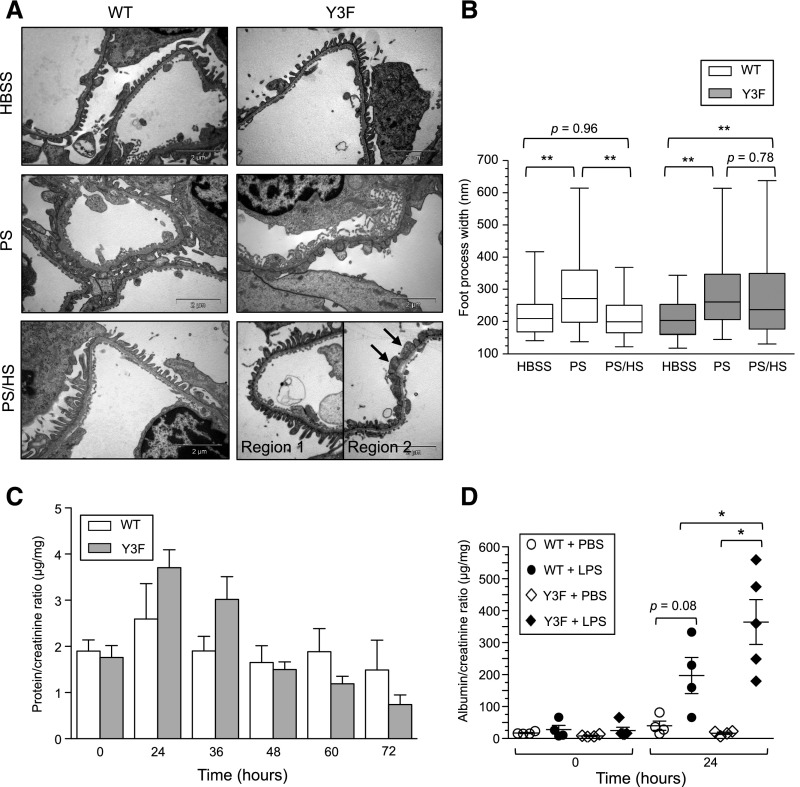
Figure 6.
C57BL/6 nephrinY3F/Y3F mice display delayed recovery in podocyte injury models. (A) Transmission EM of foot processes in nephrinWT/WT and nephrinY3F/Y3F mice perfused with HBSS, protamine sulfate (PS), or protamine sulfate followed by heparin sulfate (PS/HS). PS induces foot process spreading in both genotypes. A proportion of foot processes is restored with HS in Y3F mice (region 1), although the majority remains spread (region 2, arrows). Images are representative of two mice of each genotype per condition. Scale bar, 2 μm. (B) Box and whisker (5%–95%) plots of individual foot process widths measured via transmission EM (n=2 kidneys analyzed per treatment with a minimum of 60 measurements per mouse). Comparisons were made between treatments as indicated. (C) Quantification of total urinary protein normalized to urine creatinine shows that Y3F mice have an enhanced response to LPS–induced podocyte injury at 24 and 36 hours compared with control (Y3F: n=8–13 per time point; WT: n=4–6 per time point except at 60 hours, where n=3). (D) Quantification using ACR at 0 and 24 hours (n=4–5 per genotype). *P<0.05 by ANOVA; **P<0.01 by ANOVA.

