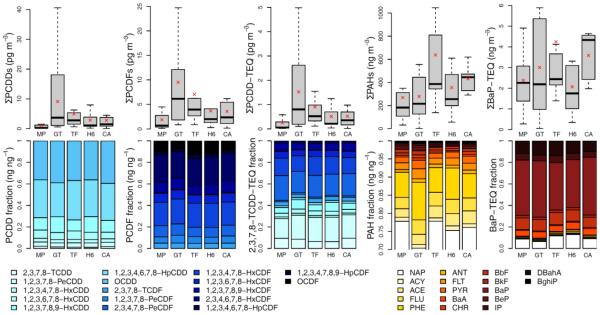
Figure 2.
Distributions of analytical results as box-plots (top) and average relative fractions of homologues and congeners (bottom). Box-plots: boxes represent inter-quartile ranges, black lines are medians, whiskers are quartiles ± (1.5*inter-quartile ranges), red crosses are arithmetical means. NAP is partially hidden on the PAH fraction plot because it represents about 70-78% of total mass concentration of PAHs. 2,3,7,8-TCDD-TEQ are computed according to TEQs proposed by Van den Berg et al.;48 BaP-TEQ are computed on TEFs according to Nisbet and LaGoy49 and Larsen and Larsen.51

