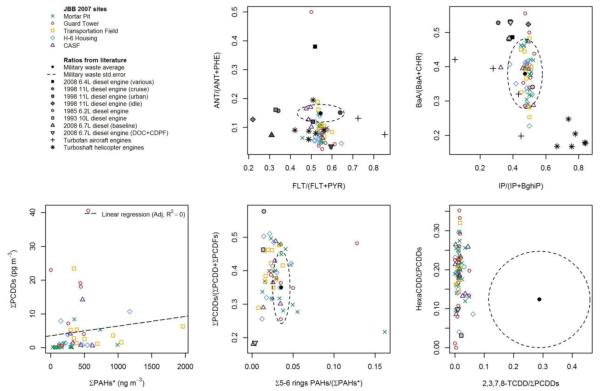
Figure 3.
Scatterplots between pairs of diagnostic ratios for PAHs (top); the regression between PCDDs and PAHs (bottom left) and mixed ratios among PCDDs, PCDFs and PAHs (bottom center and right). Data collected at JBB are colored. Data from literature are also reported for a comparison: simulated US military waste;39 legacy heavy-duty diesel engines at transient on-road settings;43 common in-use heavy-duty diesel engines without after-treatment devices at cruise, urban and idle thrusts;44 modern diesel engines with and without exhaust gas after-treatment at average conditions;42,45 various turbofan engines.57

