. 2013 Sep 18;1(2):80–86. doi: 10.4103/2321-3868.118933
© Author 2013
Open Access This article is distributed under the terms of the Creative Commons Attribution 4.0 International License (http://creativecommons.org/licenses/by/4.0/), which permits use, duplication, adaptation, distribution, and reproduction in any medium or format, as long as you give appropriate credit to the original author(s) and the source, provide a link to the Creative Commons license, and indicate if changes were made
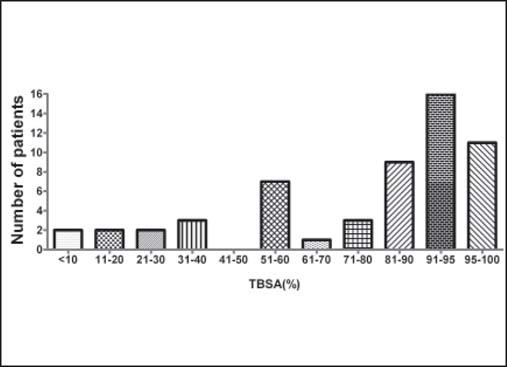
Figure 2:

The distribution of TBSA for non-survivors in our center from 2003 to 2009.
