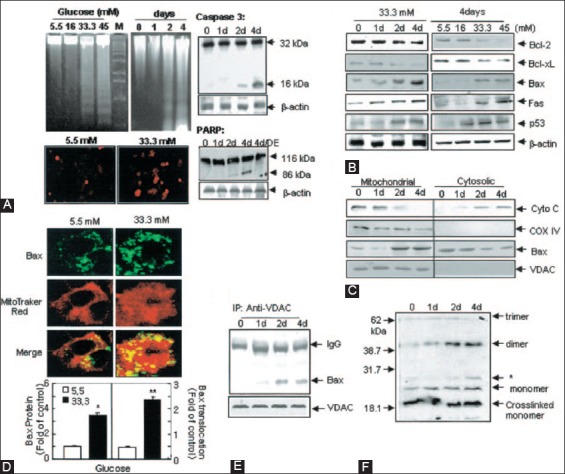
FIGURE 7.

Effects of high glucose on apoptosis in MIN6NB cells. The MIN6N8 cells were treated with different glucose concentrations (5.5-45 mM) for the indicated times. (A) DNA fragmentation (upper left) and TUNEL assay (lower left). The cleavage of caspase-3 (upper right) and poly(ADP-ribose) polymerase (PARP) (lower left) was analyzed. (B) Expression on apoptotic proteins. (C) Release of cytochrome C and Bax translocation. The blots were reprobed with antibodies to cytochrome C oxidase and voltage-dependent anion channels (VDAC). (D) Bax immunocytochemistry. Fluorescent microscopic images for Bax (green), Mito Tracker CMXRos (red) and final merged images (localization of Bax at mitochondria) are shown (upper). Fold of cells exhibiting punctuate ABax and percentage of Bax colocalization with mitochondria was determined by counting ~20-100 cells for each condition (lower). Results represent the average ± SE from three independent experiments (*p < 0.05, **p < 0.01) > (E): Interaction of Bax with VDAC, (F) Bax oligomerization. From Kim et al., Diabetes 2005;54:2601-11.
