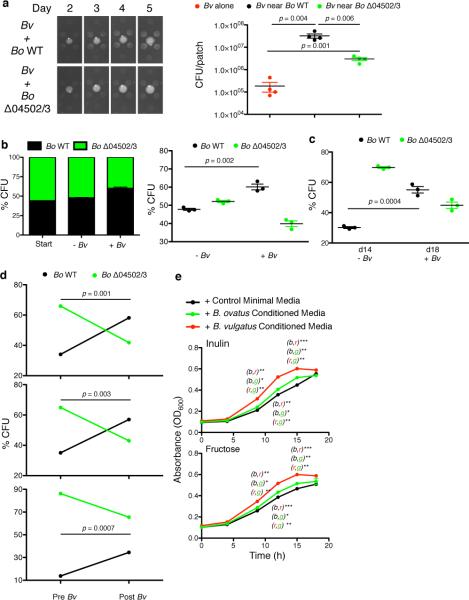
Extended Data Figure 9. Spatial aspects of mutualism between Bo and Bv via cross feeding and interspecies cooperation in vivo via 04502/3.
a, Independent experiments for Fig. 4c, n=4 biological replicates. b, Independent experiments for Fig. 4e, n=3 cell culture biological replicates. c, Scatter plot of experiment in Fig. 4f, n=3 cell culture biological replicates. d, Ratios of WT and Δ04502/3 in feces 21 days after co-colonization of three germ-free mice (n=3 mice biological replicates) on a diet of inulin as the sole dietary polysaccharide (pre-Bv) and then four days after introduction of Bv (post-Bv). Each panel shows the ratio pre- and post- Bv of an individual mouse. p values are Fisher exact test comparing the frequency of Bo WT and Δ04502/3 pre- and post- colonization with Bv for each individual mouse. At day 21, all mice were colonized with a higher ratio of the mutant (ranging to 86% in the mouse depicted in the lowest panel), with each mouse showing a statistically significant increase in the proportion of the WT after introduction of Bv. e, Growth of B. ovatus in 0.5% inulin (upper panel) or fructose (lower panel) in minimal media to which filter sterilized conditioned media from early log, OD600 matched growth of Bv or Bo in 0.125% fructose minimal media or fresh 0.125% fructose minimal media control was added at 1:1 ratio. In (e) numbers refer to p values (* <0.05, **<0.01, ***<0.001) of comparison of values of green (g), red (r) or black (b) values by unpaired, two-tailed student t test at the time-point indicated, n=2 cell culture biological replicates. For all panels, error bars represent standard error, for all panels except (d) p values derived from two-tailed Student's t test.

