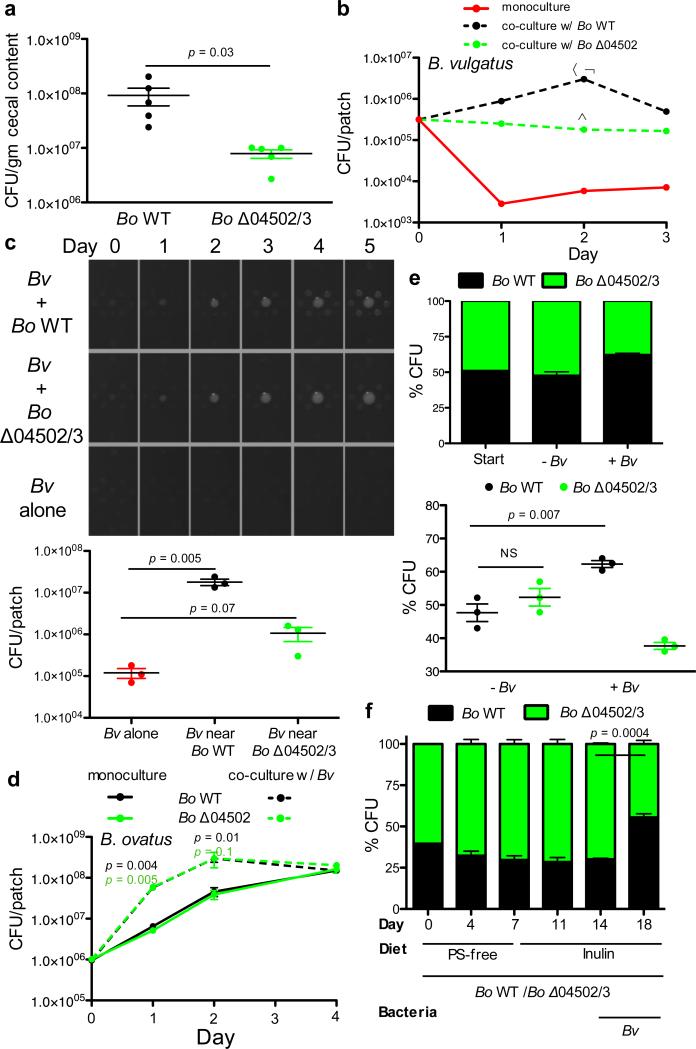
Figure 4. Interspecies cooperation mediated by surface digestion of inulin is stabilized by reciprocal benefits.
a, Germ-free mice were monocolonized with Bo WT or Δ04502/3 and maintained on a polysaccharide free diet supplemented with inulin and housed for 2 weeks. Mice were then gavaged with the cecal contents of conventionally raised mice. At day 5 post gavage, cecal contents were plated for enumeration of Bo (n=5 biological replicate mice per group). b, Enumeration of Bv in monoculture or co-culture with Bo WT or Δ04502 on defined inulin plates. α, p = 0.001 for number of Bv in Bv/Bo WT co-culture vs. Bv alone; ψ, p = 0.001 for number of Bv in Bv/Bo WT co-culture vs. Bv/Δ04502 co-culture; α, p = 0.003 for number of Bv in Bv/Δ04502 co-culture vs. Bv alone (n=2, cell culture biological replicates). See Extended Data Figs. 7 and 9 for additional independent experiments. c, (left) Photos of patches of Bv plated at varying distances around Bo WT or Bo Δ04502/3 or alone on inulin agarose plates. (right) Enumeration of Bv after five days of culture plated at the same distance to Bo WT or Bo Δ04502/3 or alone on inulin plates. See Extended Data Fig. 9 for additional independent experiments. d, Enumeration of Bo WT or Δ04502 in monoculture or co-culture with Bv on defined inulin plates. p values correlate to color of line/genotype used for statistical analysis. p value indicates comparison of monoculture and co-culture for the given condition at the time-point indicated. The benefit Bo receives from Bv is most robust when starting with fewer Bo. Depicted are starting CFU of ~106 Bo. (n=3, cell culture biological replicates at day 1,2; n=2, biological replicates at day 4). See Extended Data Fig. 7 for additional independent experiments and Extended Data Fig.7b for starting CFU of ~107 Bo. e, Ratios of WT and Δ04502/3 at the start and day 2 of culture when co-plated with or without Bv on inulin plates (n=3, cell culture biological replicates). See Extended Data Fig. 9 for additional independent experiments. f, Ratios of WT and Δ04502/3 in the inoculum (day 0) and in feces at various time points (days 4, 7, 11, 14, 18) post co-colonization of gnotobiotic mice (n=3 cell culture biological replicates) with Bo WT and Δ04502/3. Polysaccharide free diet was supplemented with inulin at day 7. Bv was introduced at day 14. A Fisher exact test comparing the frequency of Bo WT and Δ04502/3 pre- (day 14) and post- (day 18) colonization with Bv was significant with a p value of 0.0001 for each individual mouse. Bo CFU in feces were maximal after the switch to inulin diet and addition of Bv changed the abundance of Bo WT compared to Δ04502/3 but not total CFU of Bo. See Extended Data Fig. 9 for additional independent experiments. In all panels error bars represent standard error; p values displayed are derived from two-tailed Student's t test.

