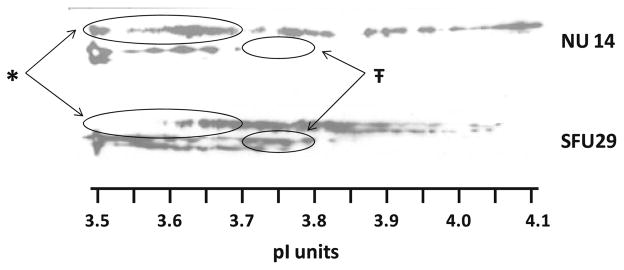
Fig. 2.
2D human OPN Western detection of representative NU and SFU samples run on 3.5–4.5 pI IEF strips. No signal was evident greater than a pI of 4.2. *Greater proportion of OPN 1 and 2 signal in the 3.5–3.7 range for NU versus SFU; 45 versus 10%, P = 0.03 (highlighted in the large ovals). ŦLesser proportion of OPN 3 and 4 signal in the 3.7–3.8 range for NU versus SFU; 10 versus 18%, P = 0.05 (highlighted with the small ovals)

