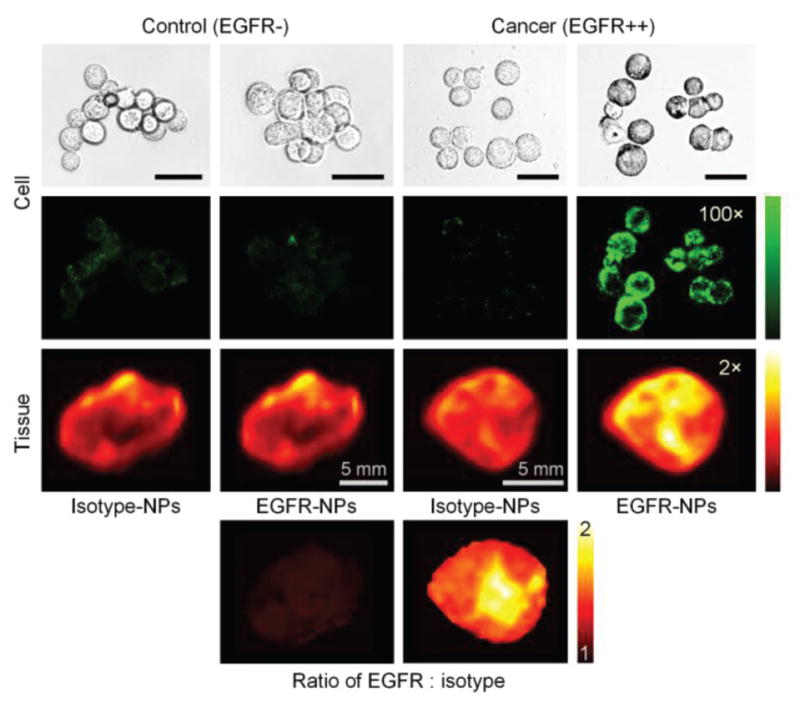
Fig. 3.

Nonspecific and specific binding of SERS NPs topically applied on cultured cells and tissues. The bright-field images (first row) and fluorescence images (second row) of NP-stained cells, and the Raman images of NP-stained tissues (third row) are shown. The green and red colormaps indicate the fluorescence intensity and Raman intensity from the SERS NPs, respectively. The bottom images show the measured concentration ratio of EGFR-NPs vs. isotype-NPs, in which the nonspecific accumulation of the NPs is normalized away and the EGFR expression is clearly revealed. The unlabeled scale bars represent 20 μm.
