
Figure 9.
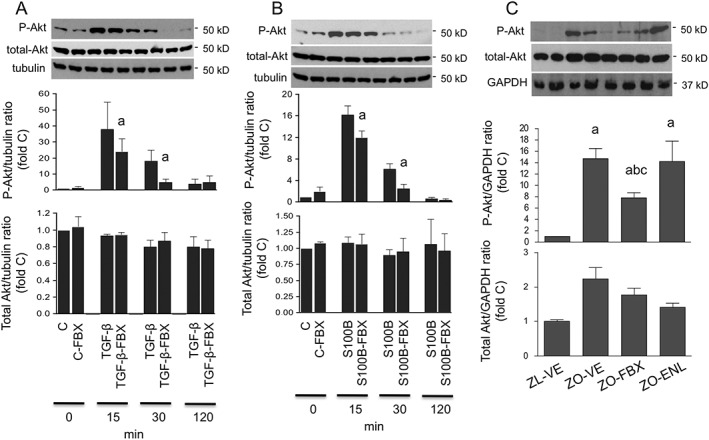
Effect of febuxostat on Akt phosphorylation. Serum‐deprived NRK cells were stimulated with TGF‐β (A) or S100B (B) for 15, 30 and 120 min in the presence or absence of FBX and compared with unstimulated cells (abbreviated as C). Ser473 phosphorylation (P‐Akt) and total Akt were determined by immunoblotting. Upper insets show representative blots of Akt and tubulin loading control. The order of lanes corresponds to conditions in bar graphs. a P < 0.05 versus TGF‐β‐ or S100B‐stimulated counterparts without FBX treatment. (C) The same technique was used for analysis of renal cortical P‐Akt and total Akt protein expression in ZL and ZO rats (n = 6 each group). The upper insets show representative Akt blots and GAPDH loading control in ZL‐VE (lanes 1–2) and ZO‐VE (lanes 3–4) rats and in ZO‐FBX (lanes 5–6) or ZO‐ENL (lanes 7–8) rats. The graphs show densitometric analysis of western blots. a P < 0.05 versus ZL‐VE; b P < 0.05 versus ZO‐VE; c P < 0.05 versus ZO‐ENL.